I showed in previous posts how FGMNX is a bond fund that gives your portfolio domestic exposure with monthly dividends, linear returns, and very minimal risk during market drawdowns. FNMIX gives you the power of increased returns of foreign (emerging market) exposure with less volatility than a stock equivalent, while also providing consistent monthly dividends. Combining the performance of both of these funds could be a simple strategy to include bond exposure in your investment portfolio to provide some diversification while maintaining reasonable returns versus risk. We looked at averaging the performance of FGMNX and FNMIX to produce returns that have exceeded the SPY over the past 18 years with less risk. In this post we will use a simple relative strength strategy to time the market and allocate our equity between each bond fund to help boost returns further while maintaining low risk exposure. The performance of the relative strength bond strategy will be compared to the performance of a buy-and-hold strategy on the SPY, which is our usual benchmark (I presented the equity curve and drawdown profile previously).
There are countless formulas for determining relative strength and momentum. In this analysis, I am using a comparison of the rolling 1 year returns for each fund using dividend adjusted data. In simpler terms, I take the current price and subtract the price 252 days ago, then divide the difference by the price 252 days ago. I compare the 1 year rolling return for FGMNX and FNMIX. The portfolio will allocate all of its equity to whichever fund has the larger 1 year rolling return and the portfolio is always 100% invested. Below is a chart comparing the 1 year rolling return of FGMNX and FNMIX.
I believe these funds are a good pair to use because they represent two types of market perspectives. Typically, when the market is weak and times are tough, money tends to flow towards US domestic equities because the thought is that they are a safe investment during bear markets. So this would be a risk-off trade. FGMNX is a good vehicle to represent this behavior because it has dow well during weak markets. When the market is strong and trending up, the risk trade is on. Money tends to flow to more speculative foreign investments to try and capture larger returns. FNMIX is a foreign bond fund that will produce larger returns than some domestic bond funds during bull markets. You could use a basket of bond funds, but I think simple is better.
Let's take a peek at the numbers and the past performance of the relative strength strategy (I will call it the RS1Yr strat). The RS1Yr strat has an average annual return of 11.86% over the past 18 years. The max drawdown over the past 18 years was -15%. The equity curve is fairly linear with a very few drawdowns exceeding -10%. Below is a chart of the equity curve for RS1Yr strat compared to the equity curve of SPY, a surrogate for the performance of the S&P500. The RS1Yr strat performs well compared to the performance of SPY which had an average annual return of 6.04% with a max drawdown of -55%. Both curves are dividend adjusted.
Like its individual components, the RS1Yr strat has done a good job of providing consistent returns that have exceeded the market, yet with less risk as indicated by the smaller drawdowns. There have certainly been times during bull markets when the SPY has outperformed the RS1Yr strat, but the RS1Yr strat returns have far exceeded the returns of SPY during bear markets. This is typical of bond performance. Below is a chart of the equity curve drawdowns for the RS1Yr strat and SPY that highlight the improved risk performance of the combined bond strategy.
Let's see what you can expect from the strategy's historical performance. The one year rolling returns for the RS1Yr strat have averaged a return of 13.7%. What this tells me is that had I chose to invest in the RS1Yr strat anytime in the past 18 years and held it for one year, I would have averaged about 13.7% returns on that one year investment. Also, 99% of the 4250 rolling one year returns were above 0%, so the odds are very good that you will make money on your investment over the course of one year. Below is a chart that shows the one year rolling returns for RS1Yr strat (green) with the average of all the rolling one year returns shown in blue.
The rolling one year max drawdowns show that there have been very few drawdowns exceeding -5%. The average rolling max drawdown was -1.7%. This tells me I can expect a drawdown of at least -1.7% over the course of an entire year. Also, 90% of the rolling one year max drawdowns were -4.3% or better, which is much better than the SPY (90% are -22.1% or better). Below is a chart that shows the one year rolling max drawdowns for RS1Yr strat (red) with the average of all these drawdowns in blue.
This relative strength bond strategy has done an exceptional job of providing consistent returns through some rough times. The SPY has had a total return of about 288% over the past 18 years because it has been range-bound for most of that time. If you were an exceptional market timer, you could have made much more during this period. For a simpler approach, the relative strength bond strategy has a total return of 756% over the past 18 years with smaller comparative drawdowns (-15% RS1Yr strat compared to -55% SPY). You would have made almost 12% a year using the relative strength bond strategy, which is a very good return considering bonds are supposed to be a conservative investment.
Despite the performance of the strategy presented here, there are some important notes that must be considered. First, the relative strength algo determines when to switch equity from one fund to another. There are also some other limitations on switching funds. You will incur short term trading fees if you hold FGMNX less than 30 days and FNMIX less than 90 days. These fees can stack up and hurt the performance of the strategy, plus you could incur further trading penalties from Fidelity. you could modify the relative strength algo to reduce whipsaws, or you may choose to only switch a portion of the the portfolio to the other fund instead of all of it. Second, you must also consider the dividend payouts. If you switch from one fund to the other in the middle of the month, you will not collect the full dividend from the bond fund. This will also reduce returns. I leave it up to the reader to test these factors to see there impact on the strategy. Regardless, there certainly does seem to be plenty of potential for this strategy.
"Good judgement comes from experience, and experience comes from bad judgement." —Barry LePatner. Chronicling the road of self-improvement through the development of expertise on the path to becoming a successful professional trader, while committing to the persistent willingness to learn from my struggles and overcome adversity.
Showing posts with label Strategy. Show all posts
Tuesday, February 28, 2012
Wednesday, February 15, 2012
Trading Thoughts - Relative Strength Bond Strategy
I spend a lot of time reading books or blogs on trading and investing. I really enjoy exposing myself to different perspectives on the market. During my journey, I have come across countless sources that have discussed a rotational stock trading strategies. Relative strength is a popular method for capturing the returns of the best performing instruments. You will commonly see this strategy applied to different stocks or stock sectors. It often generates much better returns with less risk than a traditional buy-and-hold strategy.
In all of my research, I have never seen a relative strength strategy applied to bond funds. I have seen many relative strength strategies that include a bond fund among its many asset classes, but never a relative strength strategy that solely focuses on bonds. It could be a popular topic that I haven't come across yet or it could be that bonds are not sexy enough to be considered for relative strength algorithms.
I think that bonds are an even better candidate for relative strength than stocks. Think about it for a second. Bonds have very low volatility and have a tendency to trend much more consistently than most stocks or asset classes. This should make it much easier to identify which bonds are performing well and which bonds are not. Also, when a bond goes from poor to good relative performance, it would have a better tendency to maintain that relative performance for longer periods of time, resulting in fewer performance whipsaws you may see with stocks. One final point, bonds typically produce better returns during bear markets. Therefore, if you have a stock trading strategy that is only well suited for bull markets, a bond relative strength strategy could be a fantastic compliment to your stock trading strategy during bear markets.
I am going to apply a simple relative strength analysis to my two favorite bond funds, FGMNX and FNMIX, to evaluate the potential of a bond relative strength strategy. I think most people assume that bonds have small returns compared to stocks, which in most cases is true. There are some exceptions though, especially when the stock market has been range bound for over the past decade. I believe you will find that the results of the strategy will be very enlightening.
In all of my research, I have never seen a relative strength strategy applied to bond funds. I have seen many relative strength strategies that include a bond fund among its many asset classes, but never a relative strength strategy that solely focuses on bonds. It could be a popular topic that I haven't come across yet or it could be that bonds are not sexy enough to be considered for relative strength algorithms.
I think that bonds are an even better candidate for relative strength than stocks. Think about it for a second. Bonds have very low volatility and have a tendency to trend much more consistently than most stocks or asset classes. This should make it much easier to identify which bonds are performing well and which bonds are not. Also, when a bond goes from poor to good relative performance, it would have a better tendency to maintain that relative performance for longer periods of time, resulting in fewer performance whipsaws you may see with stocks. One final point, bonds typically produce better returns during bear markets. Therefore, if you have a stock trading strategy that is only well suited for bull markets, a bond relative strength strategy could be a fantastic compliment to your stock trading strategy during bear markets.
I am going to apply a simple relative strength analysis to my two favorite bond funds, FGMNX and FNMIX, to evaluate the potential of a bond relative strength strategy. I think most people assume that bonds have small returns compared to stocks, which in most cases is true. There are some exceptions though, especially when the stock market has been range bound for over the past decade. I believe you will find that the results of the strategy will be very enlightening.
Tuesday, February 14, 2012
Trading Thoughts - Two Bonds are Better Than One - FGMNX and FNMIX
I showed in previous posts how FGMNX is a bond fund that gives your portfolio domestic exposure with monthly dividends, linear returns, and very minimal risk during market drawdowns. FNMIX gives you the power of increased returns of foreign (emerging market) exposure with less volatility than a stock equivalent, while also providing consistent monthly dividends. Combining the performance of both of these funds could be a simple strategy to include bond exposure in your investment portfolio to provide some diversification while maintaining reasonable returns versus risk.
For this analysis I am assuming that you will allocate a certain percentage of your portfolio to bonds, for example 20%. With that assumption, you would allocate 10% of your portfolio/contributions to FGMNX and 10% to FNMIX to compose the 20% exposure in your account. Obviously, each person's asset allocation will very with age and risk tolerance. The point of this analysis is to compare the performance of the combined average strategy to the individual performances previously reported as well as to the overall performance of a buy-and-hold strategy on the S&P500.
Let's take a peek at the numbers and the past performance of combining the returns of FGMNX and FNMIX (I will call it the AVG strat). The AVG strat has an average annual return of 6.95% over the past 18 years. It pays a monthly dividend and the max drawdown over the past 18 years was -23%. The equity curve is fairly linear with a few sizable drawdowns during overall market retracements. Below is a chart of the equity curve for AVG strat compared to the equity curve of SPY, a surrogate for the performance of the S&P500. The AVG strat performs well compared to the performance of SPY which had an average annual return of 6.04% with a max drawdown of -55%. Both curves are dividend adjusted.
Like its individual components, the AVG strat has done a good job of providing consistent returns comparable with the market, yet with less risk as indicated by the smaller drawdowns. There have certainly been times during bull markets when the SPY has outperformed the AVG strat by a considerable margin (internet bubble, real estate bubble, financial crisis rebound). Where the AVG strat really shines is during bear markets where it has often produced good returns compared to SPY. This is typical of bond performance. Below is a chart of the equity curve drawdowns for the AVG strat and SPY that highlight the improved risk performance of the combined bond strategy.
Let's see what you can expect from the fund's historical performance. The one year rolling returns have averaged a return of 9.7%. What this tells me is that had I chose to invest in the AVG strat anytime in the past 18 years and held it for one year, I would have averaged about 9.7% returns on that one year investment. Also, 89% of the 4250 rolling one year returns were above 0%, so the odds are good that you will make money on your investment over the course of one year. Below is a chart that shows the one year rolling returns for AVG strat (green) with the average of all the rolling one year returns shown in blue.
The rolling one year max drawdowns shows that there have been three substantial (around -20%) drawdowns. The average rolling max drawdown was -2.1%. This tells me I can expect a drawdown of at least -2.1% when I hold this investment for an entire year. Also, 90% of the rolling one year max drawdowns were -5.1% or better, which is much better than the SPY (90% are -22.1% or better). Below is a chart that shows the one year rolling max drawdowns for AVG strat (red) with the average of all these drawdowns in blue.
It is always important to remember that things can change in the future. Regardless, this average bond strategy has done an exceptional job of providing consistent returns through some rough times. The SPY has had a total return of about 288% over the past 18 years because it has been range-bound for most of that time. If you were an exceptional market timer, you could have made much more during this period. For a simpler approach, the average bond strategy has a total return of 337% over the past 18 years with smaller comparative drawdowns (-23% AVG strat compared to -55% SPY). You would have made almost 7% a year using the buy-and-hold average bond strategy, which is a very good return considering bonds are supposed to be a conservative investment.
For this analysis I am assuming that you will allocate a certain percentage of your portfolio to bonds, for example 20%. With that assumption, you would allocate 10% of your portfolio/contributions to FGMNX and 10% to FNMIX to compose the 20% exposure in your account. Obviously, each person's asset allocation will very with age and risk tolerance. The point of this analysis is to compare the performance of the combined average strategy to the individual performances previously reported as well as to the overall performance of a buy-and-hold strategy on the S&P500.
Let's take a peek at the numbers and the past performance of combining the returns of FGMNX and FNMIX (I will call it the AVG strat). The AVG strat has an average annual return of 6.95% over the past 18 years. It pays a monthly dividend and the max drawdown over the past 18 years was -23%. The equity curve is fairly linear with a few sizable drawdowns during overall market retracements. Below is a chart of the equity curve for AVG strat compared to the equity curve of SPY, a surrogate for the performance of the S&P500. The AVG strat performs well compared to the performance of SPY which had an average annual return of 6.04% with a max drawdown of -55%. Both curves are dividend adjusted.
Like its individual components, the AVG strat has done a good job of providing consistent returns comparable with the market, yet with less risk as indicated by the smaller drawdowns. There have certainly been times during bull markets when the SPY has outperformed the AVG strat by a considerable margin (internet bubble, real estate bubble, financial crisis rebound). Where the AVG strat really shines is during bear markets where it has often produced good returns compared to SPY. This is typical of bond performance. Below is a chart of the equity curve drawdowns for the AVG strat and SPY that highlight the improved risk performance of the combined bond strategy.
Let's see what you can expect from the fund's historical performance. The one year rolling returns have averaged a return of 9.7%. What this tells me is that had I chose to invest in the AVG strat anytime in the past 18 years and held it for one year, I would have averaged about 9.7% returns on that one year investment. Also, 89% of the 4250 rolling one year returns were above 0%, so the odds are good that you will make money on your investment over the course of one year. Below is a chart that shows the one year rolling returns for AVG strat (green) with the average of all the rolling one year returns shown in blue.
The rolling one year max drawdowns shows that there have been three substantial (around -20%) drawdowns. The average rolling max drawdown was -2.1%. This tells me I can expect a drawdown of at least -2.1% when I hold this investment for an entire year. Also, 90% of the rolling one year max drawdowns were -5.1% or better, which is much better than the SPY (90% are -22.1% or better). Below is a chart that shows the one year rolling max drawdowns for AVG strat (red) with the average of all these drawdowns in blue.
It is always important to remember that things can change in the future. Regardless, this average bond strategy has done an exceptional job of providing consistent returns through some rough times. The SPY has had a total return of about 288% over the past 18 years because it has been range-bound for most of that time. If you were an exceptional market timer, you could have made much more during this period. For a simpler approach, the average bond strategy has a total return of 337% over the past 18 years with smaller comparative drawdowns (-23% AVG strat compared to -55% SPY). You would have made almost 7% a year using the buy-and-hold average bond strategy, which is a very good return considering bonds are supposed to be a conservative investment.
Thursday, February 9, 2012
Trading Thoughts - Another Great Bond Fund
Last time I profiled FGMNX because it was a great bond fund with consistent/linear returns over the past 18 years. FGMNX is great for its robustness and US domestic exposure, but what if you want something with a little more punch to increase your returns?
FNMIX IS A GREAT FUND FOR FOREIGN EXPOSURE AND GOOD RETURNS.
Here is the description from Google Finance - "The investment seeks high current income; capital appreciation is a secondary objective. The fund normally invests at least 80% of assets in securities of issuers in emerging markets (countries that have an emerging stock market as defined by MSCI, countries or markets with low- to middle-income economies as classified by the World Bank, and other countries or markets with similar emerging characteristics) and other investments that are tied economically to emerging markets. It normally invests in debt securities of issuers in emerging markets. The fund potentially invests in other types of securities. It is non-diversified." In addition, the FNMIX has a 4 star Morningstar rating over the past 10 years, has an expense ratio of 0.89%, and assets totaling $4.6 billion.
FNMIX gives you the increased returns of foreign (emerging market) exposure with less volatility than a stock equivalent. Let's take a peek at the numbers and the past performance. FNMIX has an average annual return of 9.5% over the past 18 years. It pays a monthly dividend and the max drawdown over the past 18 years was -43%. The equity curve is fairly linear with a few sizeable drawdowns during market retracements. Below is a chart of the equity curve for FNMIX compared to the equity curve of SPY, a surrogate for the performance of the S&P500. Both curves are dividend adjusted.
This bond fund has done a good job of providing consistent returns comparable with the market, yet with less risk as indicated by the smaller drawdowns. I would say that FNMIX is best used as a way to diversify your portfolio with foreign exposure with the added benefit of adding the cushion of a bond to hedge against some of the stock volatility you can experience during bear markets. It is a good alternative to other foreign investments for the risk-adverse. Below is a chart of the equity curve drawdowns for FNMIX and SPY.
Let's see what you can expect from the fund's historical performance. The one year rolling returns have averaged a return of 13.4%. What this tells me is that had I chose to invest in FNMIX anytime in the past 18 years and held it for one year, I would have averaged about 13.4% returns on that one year investment. Also, 84% of the 4250 rolling one year returns were above 0%, so the odds are good that you will make money on your investment over the course of one year. Below is a chart that shows the one year rolling returns for FNMIX (green) with the average of all these returns in blue.
The rolling one year max drawdowns shows that there have been three substantial (<-20%) drawdowns. The average rolling max drawdown was -4.9%. This tells me I can expect a drawdown of at least -4.9% when I hold this investment for an entire year. Also, 90% of the rolling one year max drawdowns were -15.2% or better, which is much better than the SPY (90% are -22.1% or better). Below is a chart that shows the one year rolling max drawdowns for FGMNX (red) with the average of all these drawdowns in blue.
Now you may be asking why I am focusing on bonds. Bonds are a good way to capture market alpha without all the volatility and noise associated with stocks. The SPY has had a total return of about 288% over the past 18 years because it has been range-bound for most of that time. If you were an exceptional market timer, you could have made much more during this period. For those who like to keep things simple, bonds offer a great way to capture that performance. FNMIX has a total return of 519% over the past 18 years with smaller comparative drawdowns. You would have made almost 10% a year with a buy-and-hold strategy using this bond, which is difficult to imagine for most investments in the current era of market uncertainty.
FNMIX IS A GREAT FUND FOR FOREIGN EXPOSURE AND GOOD RETURNS.
Here is the description from Google Finance - "The investment seeks high current income; capital appreciation is a secondary objective. The fund normally invests at least 80% of assets in securities of issuers in emerging markets (countries that have an emerging stock market as defined by MSCI, countries or markets with low- to middle-income economies as classified by the World Bank, and other countries or markets with similar emerging characteristics) and other investments that are tied economically to emerging markets. It normally invests in debt securities of issuers in emerging markets. The fund potentially invests in other types of securities. It is non-diversified." In addition, the FNMIX has a 4 star Morningstar rating over the past 10 years, has an expense ratio of 0.89%, and assets totaling $4.6 billion.
FNMIX gives you the increased returns of foreign (emerging market) exposure with less volatility than a stock equivalent. Let's take a peek at the numbers and the past performance. FNMIX has an average annual return of 9.5% over the past 18 years. It pays a monthly dividend and the max drawdown over the past 18 years was -43%. The equity curve is fairly linear with a few sizeable drawdowns during market retracements. Below is a chart of the equity curve for FNMIX compared to the equity curve of SPY, a surrogate for the performance of the S&P500. Both curves are dividend adjusted.
This bond fund has done a good job of providing consistent returns comparable with the market, yet with less risk as indicated by the smaller drawdowns. I would say that FNMIX is best used as a way to diversify your portfolio with foreign exposure with the added benefit of adding the cushion of a bond to hedge against some of the stock volatility you can experience during bear markets. It is a good alternative to other foreign investments for the risk-adverse. Below is a chart of the equity curve drawdowns for FNMIX and SPY.
Let's see what you can expect from the fund's historical performance. The one year rolling returns have averaged a return of 13.4%. What this tells me is that had I chose to invest in FNMIX anytime in the past 18 years and held it for one year, I would have averaged about 13.4% returns on that one year investment. Also, 84% of the 4250 rolling one year returns were above 0%, so the odds are good that you will make money on your investment over the course of one year. Below is a chart that shows the one year rolling returns for FNMIX (green) with the average of all these returns in blue.
The rolling one year max drawdowns shows that there have been three substantial (<-20%) drawdowns. The average rolling max drawdown was -4.9%. This tells me I can expect a drawdown of at least -4.9% when I hold this investment for an entire year. Also, 90% of the rolling one year max drawdowns were -15.2% or better, which is much better than the SPY (90% are -22.1% or better). Below is a chart that shows the one year rolling max drawdowns for FGMNX (red) with the average of all these drawdowns in blue.
Now you may be asking why I am focusing on bonds. Bonds are a good way to capture market alpha without all the volatility and noise associated with stocks. The SPY has had a total return of about 288% over the past 18 years because it has been range-bound for most of that time. If you were an exceptional market timer, you could have made much more during this period. For those who like to keep things simple, bonds offer a great way to capture that performance. FNMIX has a total return of 519% over the past 18 years with smaller comparative drawdowns. You would have made almost 10% a year with a buy-and-hold strategy using this bond, which is difficult to imagine for most investments in the current era of market uncertainty.
Monday, February 6, 2012
Trading Thoughts - The Best Bond Fund in the World
Well that title may be a bit subjective. It seems like the world is always battling some kind of crisis which can add a considerable amount of volatility to the returns of the stock market. Trying to find a safer investment with a consistent history of returns can often be difficult, especially when most trading products are correlated with the overall market performance.
THIS IS WHY FGMNX IS THE GREATEST BOND FUND IN THE WORLD (right now)
Here is the Google Finance description of FGMNX - "The investment seeks a high level of current income. The fund normally invests at least 80% of assets in Ginnie Maes and repurchase agreements for Ginnie Maes. It invests in other U.S. government securities and instruments related to U.S. government securities and in U.S. government securities issued by entities that are chartered or sponsored by Congress but whose securities are neither issued nor guaranteed by the U.S. Treasury. The fund allocates assets across different market sectors and maturities and seeks to have similar overall interest rate risk to the Barclays Capital® GNMA Index. " In addition, the FGMNX has a 5 star Morningstar rating over the past 10 years, has an expense ratio of 0.45%, and assets totaling $9.8 billion.
Let's take a peek at the numbers and the past performance. FGMNX has an average annual return of 3.5% over the past 18 years. It helps that is pays a monthly dividend which helps insulate it from very large drawdowns. The max drawdown over the past 18 years was 6.43%. The equity curve is quite linear and the returns are uncorrelated with the market. Below is a chart of the equity curve for FGMNX compared to the equity curve of SPY, a surrogate for the performance of the S&P500. Both curves are dividend adjusted.
The point of this bond fund is not to outperform the S&P500. FGMNX is best utilized as as safe house during bear market drawdowns in the markets. FGMNX also serves as a good investment to act as a savings vehicle. At the time of this post, most savings accounts are returning less than 1% a year. FGMNX has consistently returned higher than this with little risk. I personally invest all of my short-term savings in FGMNX. Below is a chart of the equity curve drawdowns for FGMNX and SPY.
Let's dig a little deeper into the performance to get a better idea of what you can expect from the fund. I like to look at the one year rolling returns to get a sense of what to expect. The average rolling return was 6.3%. What this tells me is that had I chose to invest in FGMNX anytime in the past 18 years and held it for one year, I would have averaged about 6.3% returns on that one year investment. Also, 98% of the 4250 rolling one year returns were above 0%, so the odds are good that you will make money on your investment over the course of one year. Below is a chart that shows the one year rolling returns for FGMNX (green) with the average of all these returns in blue.
In order to understand the risk associated with FGMNX, I like to study the rolling one year max drawdowns. The average rolling max drawdown was -0.5%. This tells me I can expect a drawdown of at least 0.5% when I hold this investment for an entire year. Also, 90% of the rolling one year max drawdowns were -1.5% or better, so that is limited risk. Below is a chart that shows the one year rolling max drawdowns for FGMNX (red) with the average of all these drawdowns in blue.
It is always important to remember that things can change in the future. Regardless, this fund has done an exceptional job of providing consistent returns through some rough times, including the financial crisis of 2008-2009. I will continue to us it for my short-term savings and as a safe-haven during bear markets.
THIS IS WHY FGMNX IS THE GREATEST BOND FUND IN THE WORLD (right now)
Here is the Google Finance description of FGMNX - "The investment seeks a high level of current income. The fund normally invests at least 80% of assets in Ginnie Maes and repurchase agreements for Ginnie Maes. It invests in other U.S. government securities and instruments related to U.S. government securities and in U.S. government securities issued by entities that are chartered or sponsored by Congress but whose securities are neither issued nor guaranteed by the U.S. Treasury. The fund allocates assets across different market sectors and maturities and seeks to have similar overall interest rate risk to the Barclays Capital® GNMA Index. " In addition, the FGMNX has a 5 star Morningstar rating over the past 10 years, has an expense ratio of 0.45%, and assets totaling $9.8 billion.
Let's take a peek at the numbers and the past performance. FGMNX has an average annual return of 3.5% over the past 18 years. It helps that is pays a monthly dividend which helps insulate it from very large drawdowns. The max drawdown over the past 18 years was 6.43%. The equity curve is quite linear and the returns are uncorrelated with the market. Below is a chart of the equity curve for FGMNX compared to the equity curve of SPY, a surrogate for the performance of the S&P500. Both curves are dividend adjusted.
The point of this bond fund is not to outperform the S&P500. FGMNX is best utilized as as safe house during bear market drawdowns in the markets. FGMNX also serves as a good investment to act as a savings vehicle. At the time of this post, most savings accounts are returning less than 1% a year. FGMNX has consistently returned higher than this with little risk. I personally invest all of my short-term savings in FGMNX. Below is a chart of the equity curve drawdowns for FGMNX and SPY.
Let's dig a little deeper into the performance to get a better idea of what you can expect from the fund. I like to look at the one year rolling returns to get a sense of what to expect. The average rolling return was 6.3%. What this tells me is that had I chose to invest in FGMNX anytime in the past 18 years and held it for one year, I would have averaged about 6.3% returns on that one year investment. Also, 98% of the 4250 rolling one year returns were above 0%, so the odds are good that you will make money on your investment over the course of one year. Below is a chart that shows the one year rolling returns for FGMNX (green) with the average of all these returns in blue.
In order to understand the risk associated with FGMNX, I like to study the rolling one year max drawdowns. The average rolling max drawdown was -0.5%. This tells me I can expect a drawdown of at least 0.5% when I hold this investment for an entire year. Also, 90% of the rolling one year max drawdowns were -1.5% or better, so that is limited risk. Below is a chart that shows the one year rolling max drawdowns for FGMNX (red) with the average of all these drawdowns in blue.
It is always important to remember that things can change in the future. Regardless, this fund has done an exceptional job of providing consistent returns through some rough times, including the financial crisis of 2008-2009. I will continue to us it for my short-term savings and as a safe-haven during bear markets.
Sunday, February 5, 2012
You Want an Equity Curve, I'll Give You an Equity Curve...
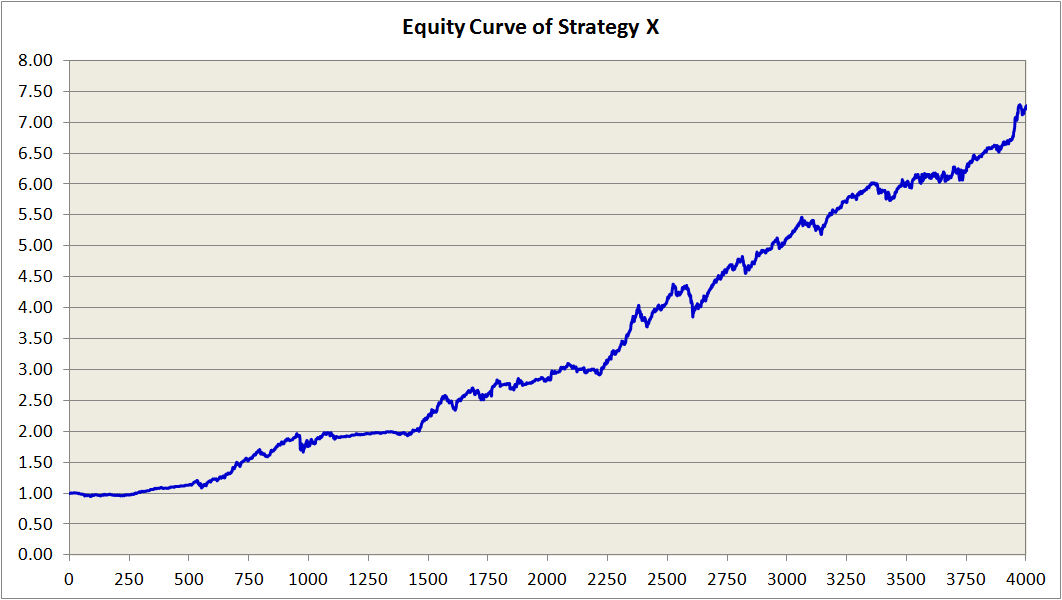
I have been working on a strategy for the past couple of weeks. It seems to have a very promising edge. The strategy is simple and only uses a few trading instruments. The instruments are liquid and the strategy is very scalable. The strategy is always invested in the markets and requires very little upkeep and monitoring (perhaps once a week). Below is the equity curve for Strategy X over the past 4000 days (about 16 years).
You can tell from the equity curve that returns have been stable for many years and returns are very consistent. The strategy has returned an average annual return around 11% and a max drawdown around -15%. The average annual return for a buy-and-hold S&P500 strategy is 6% with a max drawdown of -55%. Strategy X easily beats a buy-and-hold strategy on the S&P500 both in terms of profit and risk. Below is a plot of the drawdowns for the Strategy X equity curve.
I would say that this strategy seems to be a consistent performer with very low risk compared to many other strategies. Here is the best part, I will be revealing all the aspects of this strategy in a post in the very near future. I will tell you what instruments are being used and how you determine when to enter and exit positions. It will become another trading plan to add to my portfolio of systems. I hope that the strategy will be able to help you in your investing.
You can tell from the equity curve that returns have been stable for many years and returns are very consistent. The strategy has returned an average annual return around 11% and a max drawdown around -15%. The average annual return for a buy-and-hold S&P500 strategy is 6% with a max drawdown of -55%. Strategy X easily beats a buy-and-hold strategy on the S&P500 both in terms of profit and risk. Below is a plot of the drawdowns for the Strategy X equity curve.
I would say that this strategy seems to be a consistent performer with very low risk compared to many other strategies. Here is the best part, I will be revealing all the aspects of this strategy in a post in the very near future. I will tell you what instruments are being used and how you determine when to enter and exit positions. It will become another trading plan to add to my portfolio of systems. I hope that the strategy will be able to help you in your investing.
Friday, February 3, 2012
Trading Thoughts - What a Failed Trade Signals
I was watching a webinar by Andy Carlsen called "Tight Stop Trading for Gold, Crude Oil, and E-Mini Russell" on TraderKingdom.com. In the webinar, he discussed his day trading and showed his charts. He mentioned that sometimes his trade entries result in a failure, but this failure often leads to a failure continuation trade. This was a very interesting concept that I never really considered before.
Most of the time we will trade our systems, make our entries, then exit our positions. Sometimes this results in a profit, and sometimes it results in a loss. After this process is complete, we start over again and look for another entry. The failure continuation trade is interesting because it uses the failure of the original signal as a signal itself to reverse the position. In the webinar, the original signal would quickly fail for a small loss, but the position would be reversed and often lead to a winning trade. Rarely was there a failure of the original signal followed by a failure of the failure continuation trade.
This is just an interesting twist to add to a system and something extra to evaluate. I have read countless times that it is important to be a nimble trader and not get married to a position. The failure continuation trade can help solve this issue. When the original position is complete, can you squeeze out more profit by reversing direction? Of course this would not be applicable to symmetric systems that are always in the market, long or short. Perhaps you have a system that is not profitable, but then you can evaluate a failure continuation trade to couple with the system to potentially turn it into a profitable system.
I guess it is important to remember that a trade is not over until it's over...
Most of the time we will trade our systems, make our entries, then exit our positions. Sometimes this results in a profit, and sometimes it results in a loss. After this process is complete, we start over again and look for another entry. The failure continuation trade is interesting because it uses the failure of the original signal as a signal itself to reverse the position. In the webinar, the original signal would quickly fail for a small loss, but the position would be reversed and often lead to a winning trade. Rarely was there a failure of the original signal followed by a failure of the failure continuation trade.
This is just an interesting twist to add to a system and something extra to evaluate. I have read countless times that it is important to be a nimble trader and not get married to a position. The failure continuation trade can help solve this issue. When the original position is complete, can you squeeze out more profit by reversing direction? Of course this would not be applicable to symmetric systems that are always in the market, long or short. Perhaps you have a system that is not profitable, but then you can evaluate a failure continuation trade to couple with the system to potentially turn it into a profitable system.
I guess it is important to remember that a trade is not over until it's over...
Tuesday, January 31, 2012
Trading Thoughts - Value Entries and Improved Performance
I was watching a webinar the other day by Andy Carlen over at TraderKingdom.com called "Tight Stop Trading for Gold, Crude Oil, and E-Mini Russell". He made a point that had a impact on me and my view of entries. He briefly discussed the issue of value entries. The idea is simple, but the effect can have an incredible impact on your trading results and system.
A value entry is an entry at a better price than the initial price when your system signals you to enter. It seems like many systems traders use only one contract to enter and exit. If the system has a positive expectancy, value entries provide a method for improving your system metrics in two ways: reducing your risk on the position and increasing your profit on your position. Now you may not always be able to enter at a better price than the initial entry price because sometimes the price takes off and never looks back.
Let's look at a quick example. Let's say you have a system with a winning percentage of 50%, an average win of 10 ticks, an average loss of 5 ticks, and an expectancy of 2.5 ticks. The system normally only enters and exit with one contract. Let's say you decide to add value entries. Through testing you find out that 25% of the time you are able to enter with a second contract at a value entry with a price 1 tick better than the initial entry. Now assuming you still make the same exits, your average win for the value entry is 11 ticks, your average loss is 4 ticks, and your expectancy for the value entry position is 3.5 ticks. The value entry will increase the size of your average winner and decrease the size of your average loser. This is a powerful concept because it adds up over time.
Now this sure seems similar to averaging down, which many professionals will argue is a poor practice. I would say there is one subtle, yet important difference between averaging down and value entries. Averaging down is a result of an emotional urge to avoid losers in a futile attempt to justify the correctness of your position, while value entries are a validated/tested money management method to improve your strategy performance. Value entries are planned while averaging down is more of an impromptu reaction. The difference is all in the plan, remember that.
A value entry is an entry at a better price than the initial price when your system signals you to enter. It seems like many systems traders use only one contract to enter and exit. If the system has a positive expectancy, value entries provide a method for improving your system metrics in two ways: reducing your risk on the position and increasing your profit on your position. Now you may not always be able to enter at a better price than the initial entry price because sometimes the price takes off and never looks back.
Let's look at a quick example. Let's say you have a system with a winning percentage of 50%, an average win of 10 ticks, an average loss of 5 ticks, and an expectancy of 2.5 ticks. The system normally only enters and exit with one contract. Let's say you decide to add value entries. Through testing you find out that 25% of the time you are able to enter with a second contract at a value entry with a price 1 tick better than the initial entry. Now assuming you still make the same exits, your average win for the value entry is 11 ticks, your average loss is 4 ticks, and your expectancy for the value entry position is 3.5 ticks. The value entry will increase the size of your average winner and decrease the size of your average loser. This is a powerful concept because it adds up over time.
Now this sure seems similar to averaging down, which many professionals will argue is a poor practice. I would say there is one subtle, yet important difference between averaging down and value entries. Averaging down is a result of an emotional urge to avoid losers in a futile attempt to justify the correctness of your position, while value entries are a validated/tested money management method to improve your strategy performance. Value entries are planned while averaging down is more of an impromptu reaction. The difference is all in the plan, remember that.
Subscribe to:
Posts (Atom)