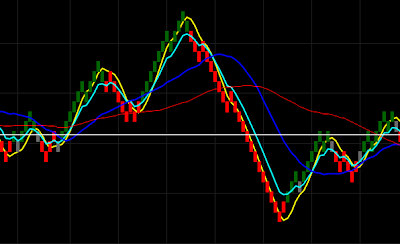
I have always been fascinated by the thought of adaptive indicators. It is probably because the thought of an indicator that can automatically adapt to the changing characteristics of the markets seems like it would be the Holy Grail of indicators, but it isn't. There is no Holy Grail indicator, but the adaptive quality still fascinates me. Although adaptive indicators can depend on complicated algos, I think the simplicity of the indicators is what appeals to me. The thought of not having to pick the ideal settings or any settings at all. It seems like an adaptive indicator would be more robust, but that isn't always the case.
I think I will begin a series of posts to explore adaptive indicators. There are a number of ways to adapt an indicator to the current market behavior. I certainly don't know all of them, but I do know of a few ways. I will post a few indicators presenting the methods for adaptation. The indicators may or may not be useful for your trading style, but it is important to understand the philosophy behind the indicators.
Showing posts with label Indicators. Show all posts
Showing posts with label Indicators. Show all posts
Wednesday, February 29, 2012


Wednesday, February 8, 2012
Indicators - Moving Average Fan Metric - Update
I went ahead and programmed the MA fan metric mentioned in the previous post here. It may serve as a way to determine the longer-term trend. The timing is not exact, but it does seem to pick up the major trends most of the time. There is some lag which becomes apparent when the price action exhibits shorter cycles.

After I posted my thoughts on the original indicator, I realized why the idea seemed so familiar. The method is very similar to your typical MACD except it is applied to more than two moving averages. All the metric would need is a signal line to make it complete. The slope of a signal line could be used to determine the trend instead of the metric line.
You can notice from the picture above that there are many small oscillations in the indicator. This is primarily due to the shortest time frame moving average. If you remove the contribution of the shortest period moving average, it will smooth out the signal a little more. It may also be possible to reconstruct a composite moving average from the resulting metric signal by creating a cumulative indicator that sums up the the metric values.

After I posted my thoughts on the original indicator, I realized why the idea seemed so familiar. The method is very similar to your typical MACD except it is applied to more than two moving averages. All the metric would need is a signal line to make it complete. The slope of a signal line could be used to determine the trend instead of the metric line.
You can notice from the picture above that there are many small oscillations in the indicator. This is primarily due to the shortest time frame moving average. If you remove the contribution of the shortest period moving average, it will smooth out the signal a little more. It may also be possible to reconstruct a composite moving average from the resulting metric signal by creating a cumulative indicator that sums up the the metric values.
Tuesday, February 7, 2012
Indicators - Moving Average Fan Market Behavior Metric
I was watching another webinar by Andy Carlsen today called "The Application of Two Indicators" which can be found at TraderKingdom.com. In the webinar, he discusses how he uses a moving average fan composed of 7 simple moving averages. He uses the moving average (MA) fan to determine if the market is trending up or down.
I was thinking to myself that there must be a way of to summarize the current state of the MA fan into a simple metric that can be used to determine if the market is trending up, trending down, or is range-bound. When the market is trending either up or down, the MA fan is spread out and each moving average is ordered sequentially from shortest period to longest period in the direction of the trend. When the market is range-bound, the moving averages do not have a uniform direction and they are crossing over one another. The picture below shows how the various MAs are aligned when the price is trending up or down.

The metric needs to summarize each of these states and clearly distinguish between them. I was thinking that comparing the difference between the indicators could provide a good summary metric. You can sum the values of the difference between each MA pair in order of of the period length, for example (MA1-MA2) + (MA2-MA3) + (MA3-MA4) +... up to the last moving average. If you are in a strongly up trending market, the metric would have a large positive value. For a strongly down trending market, the metric would have a large negative value. For a range-bound market, the moving averages would be crossing over one another so that sum of the MA pair differences would be positive and some would be negative resulting in a sum with a value closer to zero.
I personal prefer normalized indicators because the state of the indicator can easily be compared across market regimes and instruments. This would be useful to determine which trading instrument would be the best candidate for a trend trade or mean reversion trade. You can normalize the MA fan metric by dividing the sum of differences by the closing price of the current bar or perhaps the value of a middle period MA (for example if you have 7 MAs in your fan, use the value of the MA4). The normalized MA fan metric will oscillate around zero and have a typical max and min value. You can then determine positive and negative thresholds around zero to differentiate between the range-bound zone and the up/down trending zones.
I will spend a little time investigating this further. Once I have an indicator that demonstrates what I am referring to in this post, I will create an update post.
I was thinking to myself that there must be a way of to summarize the current state of the MA fan into a simple metric that can be used to determine if the market is trending up, trending down, or is range-bound. When the market is trending either up or down, the MA fan is spread out and each moving average is ordered sequentially from shortest period to longest period in the direction of the trend. When the market is range-bound, the moving averages do not have a uniform direction and they are crossing over one another. The picture below shows how the various MAs are aligned when the price is trending up or down.

The metric needs to summarize each of these states and clearly distinguish between them. I was thinking that comparing the difference between the indicators could provide a good summary metric. You can sum the values of the difference between each MA pair in order of of the period length, for example (MA1-MA2) + (MA2-MA3) + (MA3-MA4) +... up to the last moving average. If you are in a strongly up trending market, the metric would have a large positive value. For a strongly down trending market, the metric would have a large negative value. For a range-bound market, the moving averages would be crossing over one another so that sum of the MA pair differences would be positive and some would be negative resulting in a sum with a value closer to zero.
I personal prefer normalized indicators because the state of the indicator can easily be compared across market regimes and instruments. This would be useful to determine which trading instrument would be the best candidate for a trend trade or mean reversion trade. You can normalize the MA fan metric by dividing the sum of differences by the closing price of the current bar or perhaps the value of a middle period MA (for example if you have 7 MAs in your fan, use the value of the MA4). The normalized MA fan metric will oscillate around zero and have a typical max and min value. You can then determine positive and negative thresholds around zero to differentiate between the range-bound zone and the up/down trending zones.
I will spend a little time investigating this further. Once I have an indicator that demonstrates what I am referring to in this post, I will create an update post.
Thursday, February 2, 2012
Trading Thoughts - Auto-tuning Tick Charts to Match Renko
Like I have said before in prior posts, I am a fan of renko charts because they simplify the price action and act somewhat like a price filter. Unfortunately, they can be terrible for entries and exits because the price can pass through a wide range before the next bar is formed. I had a thought that it would be nice to be able to use a tick chart that was sized in such a way that it would match a corresponding renko chart. Below is a picture of a renko chart with a range of 2.

You can use the average near-term volume to determine a good tick chart size that will be representative of the renko 2 chart. In this case, I used a 20 period simple moving average. The picture above shows that the average volume is around 160. It seems that a tick size about 50% of the renko average volume produces a plot that is similar in appearance. Below is a picture of a chart with a tick size of 80, which is about 50% of the average volume from the above chart.

A comparison of the two charts shows that they are quite similar. The advantage of using the tick chart, is that we can use indicators from the renko chart to interpret signals on the tick chart. It is often easy to read indicators based on renko charts because the price action is much cleaner. Obviously, you would want to create a program that would auto-tune your chart to display the correct tick price action. An indicator could be created to represent the price action (OHLC) in the correct tick format. It is important to note that you need to be careful to make sure that there is enough volume. You don't want to be trading a chart with an average volume of 5 ticks because it could create a lot of problems. I would suggest putting a minimum requirement that the number of ticks cannot go below, for example 30.

You can use the average near-term volume to determine a good tick chart size that will be representative of the renko 2 chart. In this case, I used a 20 period simple moving average. The picture above shows that the average volume is around 160. It seems that a tick size about 50% of the renko average volume produces a plot that is similar in appearance. Below is a picture of a chart with a tick size of 80, which is about 50% of the average volume from the above chart.

A comparison of the two charts shows that they are quite similar. The advantage of using the tick chart, is that we can use indicators from the renko chart to interpret signals on the tick chart. It is often easy to read indicators based on renko charts because the price action is much cleaner. Obviously, you would want to create a program that would auto-tune your chart to display the correct tick price action. An indicator could be created to represent the price action (OHLC) in the correct tick format. It is important to note that you need to be careful to make sure that there is enough volume. You don't want to be trading a chart with an average volume of 5 ticks because it could create a lot of problems. I would suggest putting a minimum requirement that the number of ticks cannot go below, for example 30.
Thursday, January 26, 2012
Indicators - Market Breadth MA Crossover Count %
I was thinking about market breadth yesterday and had some ideas about how to measure. There are many different ways to measure market breadth of stock participation in a given market move. I have seen countless cases of people using moving average cross overs to gauge the strength of weakness of the market, i.e. 50 day average crossing the 200 day average. But is there possibly a better way to measure the underlying breadth?
I was reading "Smarter Investing in Any Economy: The Definitive Guide to Relative Strength Investing" by Michael Carr and he tested several measures of relative strength on many Fidelity Select sector funds. He found that a normalized moving average crossover on a weekly time frame worked well for measuring the relative strength of the funds. I setup a spreadsheet that uses the 8 week and 15 week simple moving crossover on 40 Fidelity Select sector funds and then ranks them. I don't really prefer to trade this way because of the inherent lag induced by the simple moving averages. You can often end up exiting positions during significant retracements.
Instead of using the relative strength to determine which funds were behaving the "best", I was thinking I could use it to determine market participation and whether there was strength behind the move. I setup a column in my spreadsheet to determine the percentage of the 40 funds that had an 8 week simple moving average above their 15 week simple moving average. When the reading was near 100%, I knew that almost all sectors were participating in the up trend. When the reading was near 0%, I knew all sectors were participating in the down trend. Of course you can optimize the moving average lengths to improve the indicator, but the overall goal is to understand the market breadth. Usually, as an up trend continues there is less and less participation until finally the strength collapses and a down trend initiates. This indicator can sometimes tell you when this occurs.
Obviously, this is just an idea right now and more research is need to see if it would be useful. I think one of the best ways to use it would be to determine when to enter longs and when to enter shorts. If the indicator is greater than some percentage, you could look for long entries. The opposite could work for short entries. Combining this indicator with a short term oscillator may yield an interesting strategy for swing trading the markets and entering on a pull back. This type of market breadth indicator may also help you avoid those times when the market is range bound if the percentages are near 50%.
Another useful way to use the indicator is to apply classical sector analysis theory. You can use the measure to see if most of the up-trending sectors are defensive (utilities, healthcare, defense) or offensive (technology, materials, consumer discretionary). Also, if we are beginning a new bull market uptrend, you could see which sectors are doing well to determine if there is new leadership and good sector rotation. In the Carr book, he develops a strategy to always be long the market by pick the best few sectors, which can result in large drawdowns during times like the 2008 financial crisis where everything is going down. You could use this indicator to determine when to exit all longs and be entirely in cash, or perhaps entering a bearish fund to capitalize on the downturn. I am sure there are plenty of other ways to use this indicator, but I am sure you are starting to get the idea how this market breadth indicator could be useful.
One final thought, I am not sure if the individual sector moving average cross over would be much different from the composite behavior of a moving average crossover on an index. I believe there would certainly be a difference if you were to setup the same moving average cross over count on the individual component stocks of the Russell 2000 index and compared it to a moving average cross over on the index itself. This idea could also be applied to any trend indicator too, not just a moving average cross over.
I was reading "Smarter Investing in Any Economy: The Definitive Guide to Relative Strength Investing" by Michael Carr and he tested several measures of relative strength on many Fidelity Select sector funds. He found that a normalized moving average crossover on a weekly time frame worked well for measuring the relative strength of the funds. I setup a spreadsheet that uses the 8 week and 15 week simple moving crossover on 40 Fidelity Select sector funds and then ranks them. I don't really prefer to trade this way because of the inherent lag induced by the simple moving averages. You can often end up exiting positions during significant retracements.
Instead of using the relative strength to determine which funds were behaving the "best", I was thinking I could use it to determine market participation and whether there was strength behind the move. I setup a column in my spreadsheet to determine the percentage of the 40 funds that had an 8 week simple moving average above their 15 week simple moving average. When the reading was near 100%, I knew that almost all sectors were participating in the up trend. When the reading was near 0%, I knew all sectors were participating in the down trend. Of course you can optimize the moving average lengths to improve the indicator, but the overall goal is to understand the market breadth. Usually, as an up trend continues there is less and less participation until finally the strength collapses and a down trend initiates. This indicator can sometimes tell you when this occurs.
Obviously, this is just an idea right now and more research is need to see if it would be useful. I think one of the best ways to use it would be to determine when to enter longs and when to enter shorts. If the indicator is greater than some percentage, you could look for long entries. The opposite could work for short entries. Combining this indicator with a short term oscillator may yield an interesting strategy for swing trading the markets and entering on a pull back. This type of market breadth indicator may also help you avoid those times when the market is range bound if the percentages are near 50%.
Another useful way to use the indicator is to apply classical sector analysis theory. You can use the measure to see if most of the up-trending sectors are defensive (utilities, healthcare, defense) or offensive (technology, materials, consumer discretionary). Also, if we are beginning a new bull market uptrend, you could see which sectors are doing well to determine if there is new leadership and good sector rotation. In the Carr book, he develops a strategy to always be long the market by pick the best few sectors, which can result in large drawdowns during times like the 2008 financial crisis where everything is going down. You could use this indicator to determine when to exit all longs and be entirely in cash, or perhaps entering a bearish fund to capitalize on the downturn. I am sure there are plenty of other ways to use this indicator, but I am sure you are starting to get the idea how this market breadth indicator could be useful.
One final thought, I am not sure if the individual sector moving average cross over would be much different from the composite behavior of a moving average crossover on an index. I believe there would certainly be a difference if you were to setup the same moving average cross over count on the individual component stocks of the Russell 2000 index and compared it to a moving average cross over on the index itself. This idea could also be applied to any trend indicator too, not just a moving average cross over.
Tuesday, January 24, 2012
Indicators - Ehlers Dominant Cycle
If you haven't had a chance yet, you need to read "Cybernetic Analysis for Stocks and Futures: Cutting-Edge DSP Technology to Improve Your Trading" by John Ehlers. It is an incredible read, especially for someone like me with an engineering background. He clearly lays out the development of some novel indicators and also includes the easy language code.
One of the indicators he developed was the dominant cycle indicator. The dominant cycle indicator measures the period length of the dominant frequency cycle. The values general range from 10 to 40 periods and works on any time frame. There is some inherent lag in the calculation, which I believe is about 8 bars. Regardless, it is the fastest (shortest lag) calculation of the dominant cycle. Below is a screen shot of the indicator.

As I mentioned before, the indicator does cycle quite a bit from 10 to 40 periods. The only issue is the indicator is backward-looking. So when the cycle period is large (around 40), a trend has already occurred and it may be too late to capitalize on it. There are some very effective ways to use the indicator though. A mean reversion type trade is a possibility. Actually, it would be more of a breakout system. You would plan to enter a trade at the beginning of a trend when the dominant cycle is low (around 10). Of course you would need some other entry signals to confirm the initiation of the trend.
Using the dominant cycle to adapt common indicators is one of the more novel uses presented in the book. Imagine using the RSI. Instead of having a fixed period length, you could use the dominant cycle to make the period length adaptable. The RSI would then use a smaller period when the cycle is smaller, or use a larger period when the cycle is larger. You must be careful of the lag though because you could be out of phase with the data if the period is small enough. The possibilities are endless though and this indicator makes for a good launch pad for adaptable indicators.
I have some interesting ideas on how to use this indicator to create a better moving average and stop loss system. I will do some research on the topic and present the results when they are ready.
One of the indicators he developed was the dominant cycle indicator. The dominant cycle indicator measures the period length of the dominant frequency cycle. The values general range from 10 to 40 periods and works on any time frame. There is some inherent lag in the calculation, which I believe is about 8 bars. Regardless, it is the fastest (shortest lag) calculation of the dominant cycle. Below is a screen shot of the indicator.

As I mentioned before, the indicator does cycle quite a bit from 10 to 40 periods. The only issue is the indicator is backward-looking. So when the cycle period is large (around 40), a trend has already occurred and it may be too late to capitalize on it. There are some very effective ways to use the indicator though. A mean reversion type trade is a possibility. Actually, it would be more of a breakout system. You would plan to enter a trade at the beginning of a trend when the dominant cycle is low (around 10). Of course you would need some other entry signals to confirm the initiation of the trend.
Using the dominant cycle to adapt common indicators is one of the more novel uses presented in the book. Imagine using the RSI. Instead of having a fixed period length, you could use the dominant cycle to make the period length adaptable. The RSI would then use a smaller period when the cycle is smaller, or use a larger period when the cycle is larger. You must be careful of the lag though because you could be out of phase with the data if the period is small enough. The possibilities are endless though and this indicator makes for a good launch pad for adaptable indicators.
I have some interesting ideas on how to use this indicator to create a better moving average and stop loss system. I will do some research on the topic and present the results when they are ready.
Monday, January 23, 2012
Indicators - Renko Charts
I have been researching ways to filter price data according to trend for my day trading strategy. I have considered using multiple time frame analysis to create a composite filter, but I wanted to start off with something a little more simple.
I really like the appearance of Renko charts. For those who do not know, Renko charts act like a price filter by only plotting a bar when the price action has made a move of a specified number of ticks. For example, if you set the Renko range to 2 ticks, a bar will only print if the price moves up two ticks from the high of the last bar or down two ticks from the low of the last bar. The result is a plot that looks like a series of bricks. This helps to filter out a lot of price noise. If you get sideways action that does not penetrate the range boundaries, no new bar will print. This helps to preserve the underlying trend and seems to be more favorable for trend indicators because of the clean trending action. It also seems to be much easier to identify small retracements in the trend that could be good entry opportunities. I will be looking into this in the future.
I have experimented with some indicators using Renko charts and the results show some promise. I am thinking of using a higher magnitude Renko chart to determine the trend. Perhaps a setting between 6-10 ticks depending on the recent market volatility. In fact, it would probably be better to automate the adjustment of the brick size based on the recent volatility.
One note, be careful when backtesting with Renko charts. Backtest results can often be inaccurate because much of the price data is not preserved in the data bars. This is especially true on reversals and your results tend to come out more favorable than they would if you were testing with live data. Also, since Renko charts are only concerned with price and not time, be sure to check volume levels carefully. Low volume data will appear to be great trading opportunities because the price can get pushed over large ranges on low volume.

I really like the appearance of Renko charts. For those who do not know, Renko charts act like a price filter by only plotting a bar when the price action has made a move of a specified number of ticks. For example, if you set the Renko range to 2 ticks, a bar will only print if the price moves up two ticks from the high of the last bar or down two ticks from the low of the last bar. The result is a plot that looks like a series of bricks. This helps to filter out a lot of price noise. If you get sideways action that does not penetrate the range boundaries, no new bar will print. This helps to preserve the underlying trend and seems to be more favorable for trend indicators because of the clean trending action. It also seems to be much easier to identify small retracements in the trend that could be good entry opportunities. I will be looking into this in the future.
I have experimented with some indicators using Renko charts and the results show some promise. I am thinking of using a higher magnitude Renko chart to determine the trend. Perhaps a setting between 6-10 ticks depending on the recent market volatility. In fact, it would probably be better to automate the adjustment of the brick size based on the recent volatility.
One note, be careful when backtesting with Renko charts. Backtest results can often be inaccurate because much of the price data is not preserved in the data bars. This is especially true on reversals and your results tend to come out more favorable than they would if you were testing with live data. Also, since Renko charts are only concerned with price and not time, be sure to check volume levels carefully. Low volume data will appear to be great trading opportunities because the price can get pushed over large ranges on low volume.
Subscribe to:
Posts (Atom)