I have always been fascinated by the thought of adaptive indicators. It is probably because the thought of an indicator that can automatically adapt to the changing characteristics of the markets seems like it would be the Holy Grail of indicators, but it isn't. There is no Holy Grail indicator, but the adaptive quality still fascinates me. Although adaptive indicators can depend on complicated algos, I think the simplicity of the indicators is what appeals to me. The thought of not having to pick the ideal settings or any settings at all. It seems like an adaptive indicator would be more robust, but that isn't always the case.
I think I will begin a series of posts to explore adaptive indicators. There are a number of ways to adapt an indicator to the current market behavior. I certainly don't know all of them, but I do know of a few ways. I will post a few indicators presenting the methods for adaptation. The indicators may or may not be useful for your trading style, but it is important to understand the philosophy behind the indicators.
Showing posts with label Thoughts. Show all posts
Showing posts with label Thoughts. Show all posts
Wednesday, February 29, 2012


Tuesday, February 28, 2012
Trading Thoughts - 1 Year Relative Strength Bond Strategy
I showed in previous posts how FGMNX is a bond fund that gives your portfolio domestic exposure with monthly dividends, linear returns, and very minimal risk during market drawdowns. FNMIX gives you the power of increased returns of foreign (emerging market) exposure with less volatility than a stock equivalent, while also providing consistent monthly dividends. Combining the performance of both of these funds could be a simple strategy to include bond exposure in your investment portfolio to provide some diversification while maintaining reasonable returns versus risk. We looked at averaging the performance of FGMNX and FNMIX to produce returns that have exceeded the SPY over the past 18 years with less risk. In this post we will use a simple relative strength strategy to time the market and allocate our equity between each bond fund to help boost returns further while maintaining low risk exposure. The performance of the relative strength bond strategy will be compared to the performance of a buy-and-hold strategy on the SPY, which is our usual benchmark (I presented the equity curve and drawdown profile previously).
There are countless formulas for determining relative strength and momentum. In this analysis, I am using a comparison of the rolling 1 year returns for each fund using dividend adjusted data. In simpler terms, I take the current price and subtract the price 252 days ago, then divide the difference by the price 252 days ago. I compare the 1 year rolling return for FGMNX and FNMIX. The portfolio will allocate all of its equity to whichever fund has the larger 1 year rolling return and the portfolio is always 100% invested. Below is a chart comparing the 1 year rolling return of FGMNX and FNMIX.

I believe these funds are a good pair to use because they represent two types of market perspectives. Typically, when the market is weak and times are tough, money tends to flow towards US domestic equities because the thought is that they are a safe investment during bear markets. So this would be a risk-off trade. FGMNX is a good vehicle to represent this behavior because it has dow well during weak markets. When the market is strong and trending up, the risk trade is on. Money tends to flow to more speculative foreign investments to try and capture larger returns. FNMIX is a foreign bond fund that will produce larger returns than some domestic bond funds during bull markets. You could use a basket of bond funds, but I think simple is better.
Let's take a peek at the numbers and the past performance of the relative strength strategy (I will call it the RS1Yr strat). The RS1Yr strat has an average annual return of 11.86% over the past 18 years. The max drawdown over the past 18 years was -15%. The equity curve is fairly linear with a very few drawdowns exceeding -10%. Below is a chart of the equity curve for RS1Yr strat compared to the equity curve of SPY, a surrogate for the performance of the S&P500. The RS1Yr strat performs well compared to the performance of SPY which had an average annual return of 6.04% with a max drawdown of -55%. Both curves are dividend adjusted.

Like its individual components, the RS1Yr strat has done a good job of providing consistent returns that have exceeded the market, yet with less risk as indicated by the smaller drawdowns. There have certainly been times during bull markets when the SPY has outperformed the RS1Yr strat, but the RS1Yr strat returns have far exceeded the returns of SPY during bear markets. This is typical of bond performance. Below is a chart of the equity curve drawdowns for the RS1Yr strat and SPY that highlight the improved risk performance of the combined bond strategy.

Let's see what you can expect from the strategy's historical performance. The one year rolling returns for the RS1Yr strat have averaged a return of 13.7%. What this tells me is that had I chose to invest in the RS1Yr strat anytime in the past 18 years and held it for one year, I would have averaged about 13.7% returns on that one year investment. Also, 99% of the 4250 rolling one year returns were above 0%, so the odds are very good that you will make money on your investment over the course of one year. Below is a chart that shows the one year rolling returns for RS1Yr strat (green) with the average of all the rolling one year returns shown in blue.

The rolling one year max drawdowns show that there have been very few drawdowns exceeding -5%. The average rolling max drawdown was -1.7%. This tells me I can expect a drawdown of at least -1.7% over the course of an entire year. Also, 90% of the rolling one year max drawdowns were -4.3% or better, which is much better than the SPY (90% are -22.1% or better). Below is a chart that shows the one year rolling max drawdowns for RS1Yr strat (red) with the average of all these drawdowns in blue.

This relative strength bond strategy has done an exceptional job of providing consistent returns through some rough times. The SPY has had a total return of about 288% over the past 18 years because it has been range-bound for most of that time. If you were an exceptional market timer, you could have made much more during this period. For a simpler approach, the relative strength bond strategy has a total return of 756% over the past 18 years with smaller comparative drawdowns (-15% RS1Yr strat compared to -55% SPY). You would have made almost 12% a year using the relative strength bond strategy, which is a very good return considering bonds are supposed to be a conservative investment.
Despite the performance of the strategy presented here, there are some important notes that must be considered. First, the relative strength algo determines when to switch equity from one fund to another. There are also some other limitations on switching funds. You will incur short term trading fees if you hold FGMNX less than 30 days and FNMIX less than 90 days. These fees can stack up and hurt the performance of the strategy, plus you could incur further trading penalties from Fidelity. you could modify the relative strength algo to reduce whipsaws, or you may choose to only switch a portion of the the portfolio to the other fund instead of all of it. Second, you must also consider the dividend payouts. If you switch from one fund to the other in the middle of the month, you will not collect the full dividend from the bond fund. This will also reduce returns. I leave it up to the reader to test these factors to see there impact on the strategy. Regardless, there certainly does seem to be plenty of potential for this strategy.
There are countless formulas for determining relative strength and momentum. In this analysis, I am using a comparison of the rolling 1 year returns for each fund using dividend adjusted data. In simpler terms, I take the current price and subtract the price 252 days ago, then divide the difference by the price 252 days ago. I compare the 1 year rolling return for FGMNX and FNMIX. The portfolio will allocate all of its equity to whichever fund has the larger 1 year rolling return and the portfolio is always 100% invested. Below is a chart comparing the 1 year rolling return of FGMNX and FNMIX.

I believe these funds are a good pair to use because they represent two types of market perspectives. Typically, when the market is weak and times are tough, money tends to flow towards US domestic equities because the thought is that they are a safe investment during bear markets. So this would be a risk-off trade. FGMNX is a good vehicle to represent this behavior because it has dow well during weak markets. When the market is strong and trending up, the risk trade is on. Money tends to flow to more speculative foreign investments to try and capture larger returns. FNMIX is a foreign bond fund that will produce larger returns than some domestic bond funds during bull markets. You could use a basket of bond funds, but I think simple is better.
Let's take a peek at the numbers and the past performance of the relative strength strategy (I will call it the RS1Yr strat). The RS1Yr strat has an average annual return of 11.86% over the past 18 years. The max drawdown over the past 18 years was -15%. The equity curve is fairly linear with a very few drawdowns exceeding -10%. Below is a chart of the equity curve for RS1Yr strat compared to the equity curve of SPY, a surrogate for the performance of the S&P500. The RS1Yr strat performs well compared to the performance of SPY which had an average annual return of 6.04% with a max drawdown of -55%. Both curves are dividend adjusted.

Like its individual components, the RS1Yr strat has done a good job of providing consistent returns that have exceeded the market, yet with less risk as indicated by the smaller drawdowns. There have certainly been times during bull markets when the SPY has outperformed the RS1Yr strat, but the RS1Yr strat returns have far exceeded the returns of SPY during bear markets. This is typical of bond performance. Below is a chart of the equity curve drawdowns for the RS1Yr strat and SPY that highlight the improved risk performance of the combined bond strategy.

Let's see what you can expect from the strategy's historical performance. The one year rolling returns for the RS1Yr strat have averaged a return of 13.7%. What this tells me is that had I chose to invest in the RS1Yr strat anytime in the past 18 years and held it for one year, I would have averaged about 13.7% returns on that one year investment. Also, 99% of the 4250 rolling one year returns were above 0%, so the odds are very good that you will make money on your investment over the course of one year. Below is a chart that shows the one year rolling returns for RS1Yr strat (green) with the average of all the rolling one year returns shown in blue.

The rolling one year max drawdowns show that there have been very few drawdowns exceeding -5%. The average rolling max drawdown was -1.7%. This tells me I can expect a drawdown of at least -1.7% over the course of an entire year. Also, 90% of the rolling one year max drawdowns were -4.3% or better, which is much better than the SPY (90% are -22.1% or better). Below is a chart that shows the one year rolling max drawdowns for RS1Yr strat (red) with the average of all these drawdowns in blue.

This relative strength bond strategy has done an exceptional job of providing consistent returns through some rough times. The SPY has had a total return of about 288% over the past 18 years because it has been range-bound for most of that time. If you were an exceptional market timer, you could have made much more during this period. For a simpler approach, the relative strength bond strategy has a total return of 756% over the past 18 years with smaller comparative drawdowns (-15% RS1Yr strat compared to -55% SPY). You would have made almost 12% a year using the relative strength bond strategy, which is a very good return considering bonds are supposed to be a conservative investment.
Despite the performance of the strategy presented here, there are some important notes that must be considered. First, the relative strength algo determines when to switch equity from one fund to another. There are also some other limitations on switching funds. You will incur short term trading fees if you hold FGMNX less than 30 days and FNMIX less than 90 days. These fees can stack up and hurt the performance of the strategy, plus you could incur further trading penalties from Fidelity. you could modify the relative strength algo to reduce whipsaws, or you may choose to only switch a portion of the the portfolio to the other fund instead of all of it. Second, you must also consider the dividend payouts. If you switch from one fund to the other in the middle of the month, you will not collect the full dividend from the bond fund. This will also reduce returns. I leave it up to the reader to test these factors to see there impact on the strategy. Regardless, there certainly does seem to be plenty of potential for this strategy.
Thursday, February 16, 2012
Trading Thoughts - Renko and Range Bar Volatility
I believe that stops, profit targets, and position sizing should be adjusted for volatility. This is a common practice among many traders to help manage their risk. I also prefer to use renko or range bar charts when trading. These charts are great because every bar is the same size and it helps weed out low volatility behavior. Unfortunately, the strength of renko and range bars is also their biggest weakness. The big down side with renko and range bars is that you cannot use average true range to determine volatility because all the bars are the same size, so the charts are already adjusted for volatility. This makes it difficult to size stops.
Would it be practical to use a fixed size stop when using range bar charts? It does not seem so. The price action still has some volatility in its movement, its just volatility that can't be measured by individual bars. You have to account for the behavior of groups of bars and not just single bars.
So how do we go about measuring the volatility of range bar charts? Perhaps using something like Bollinger bands that utilize standard deviation to calculate a measure of volatility is the answer. Maybe calculating the difference between the 10 bar high and the 10 bar low is the answer. Maybe using the three bar low or high to set stops is the answer. The thing that was great about average true range is that it was a very elegant and simple solution to the volatility issue. I would prefer to find a method that is similar in its practicality.
Any suggestions?
Would it be practical to use a fixed size stop when using range bar charts? It does not seem so. The price action still has some volatility in its movement, its just volatility that can't be measured by individual bars. You have to account for the behavior of groups of bars and not just single bars.
So how do we go about measuring the volatility of range bar charts? Perhaps using something like Bollinger bands that utilize standard deviation to calculate a measure of volatility is the answer. Maybe calculating the difference between the 10 bar high and the 10 bar low is the answer. Maybe using the three bar low or high to set stops is the answer. The thing that was great about average true range is that it was a very elegant and simple solution to the volatility issue. I would prefer to find a method that is similar in its practicality.
Any suggestions?
Wednesday, February 15, 2012
Trading Thoughts - Relative Strength Bond Strategy
I spend a lot of time reading books or blogs on trading and investing. I really enjoy exposing myself to different perspectives on the market. During my journey, I have come across countless sources that have discussed a rotational stock trading strategies. Relative strength is a popular method for capturing the returns of the best performing instruments. You will commonly see this strategy applied to different stocks or stock sectors. It often generates much better returns with less risk than a traditional buy-and-hold strategy.
In all of my research, I have never seen a relative strength strategy applied to bond funds. I have seen many relative strength strategies that include a bond fund among its many asset classes, but never a relative strength strategy that solely focuses on bonds. It could be a popular topic that I haven't come across yet or it could be that bonds are not sexy enough to be considered for relative strength algorithms.
I think that bonds are an even better candidate for relative strength than stocks. Think about it for a second. Bonds have very low volatility and have a tendency to trend much more consistently than most stocks or asset classes. This should make it much easier to identify which bonds are performing well and which bonds are not. Also, when a bond goes from poor to good relative performance, it would have a better tendency to maintain that relative performance for longer periods of time, resulting in fewer performance whipsaws you may see with stocks. One final point, bonds typically produce better returns during bear markets. Therefore, if you have a stock trading strategy that is only well suited for bull markets, a bond relative strength strategy could be a fantastic compliment to your stock trading strategy during bear markets.
I am going to apply a simple relative strength analysis to my two favorite bond funds, FGMNX and FNMIX, to evaluate the potential of a bond relative strength strategy. I think most people assume that bonds have small returns compared to stocks, which in most cases is true. There are some exceptions though, especially when the stock market has been range bound for over the past decade. I believe you will find that the results of the strategy will be very enlightening.
In all of my research, I have never seen a relative strength strategy applied to bond funds. I have seen many relative strength strategies that include a bond fund among its many asset classes, but never a relative strength strategy that solely focuses on bonds. It could be a popular topic that I haven't come across yet or it could be that bonds are not sexy enough to be considered for relative strength algorithms.
I think that bonds are an even better candidate for relative strength than stocks. Think about it for a second. Bonds have very low volatility and have a tendency to trend much more consistently than most stocks or asset classes. This should make it much easier to identify which bonds are performing well and which bonds are not. Also, when a bond goes from poor to good relative performance, it would have a better tendency to maintain that relative performance for longer periods of time, resulting in fewer performance whipsaws you may see with stocks. One final point, bonds typically produce better returns during bear markets. Therefore, if you have a stock trading strategy that is only well suited for bull markets, a bond relative strength strategy could be a fantastic compliment to your stock trading strategy during bear markets.
I am going to apply a simple relative strength analysis to my two favorite bond funds, FGMNX and FNMIX, to evaluate the potential of a bond relative strength strategy. I think most people assume that bonds have small returns compared to stocks, which in most cases is true. There are some exceptions though, especially when the stock market has been range bound for over the past decade. I believe you will find that the results of the strategy will be very enlightening.
Tuesday, February 14, 2012
Trading Thoughts - Two Bonds are Better Than One - FGMNX and FNMIX
I showed in previous posts how FGMNX is a bond fund that gives your portfolio domestic exposure with monthly dividends, linear returns, and very minimal risk during market drawdowns. FNMIX gives you the power of increased returns of foreign (emerging market) exposure with less volatility than a stock equivalent, while also providing consistent monthly dividends. Combining the performance of both of these funds could be a simple strategy to include bond exposure in your investment portfolio to provide some diversification while maintaining reasonable returns versus risk.
For this analysis I am assuming that you will allocate a certain percentage of your portfolio to bonds, for example 20%. With that assumption, you would allocate 10% of your portfolio/contributions to FGMNX and 10% to FNMIX to compose the 20% exposure in your account. Obviously, each person's asset allocation will very with age and risk tolerance. The point of this analysis is to compare the performance of the combined average strategy to the individual performances previously reported as well as to the overall performance of a buy-and-hold strategy on the S&P500.
Let's take a peek at the numbers and the past performance of combining the returns of FGMNX and FNMIX (I will call it the AVG strat). The AVG strat has an average annual return of 6.95% over the past 18 years. It pays a monthly dividend and the max drawdown over the past 18 years was -23%. The equity curve is fairly linear with a few sizable drawdowns during overall market retracements. Below is a chart of the equity curve for AVG strat compared to the equity curve of SPY, a surrogate for the performance of the S&P500. The AVG strat performs well compared to the performance of SPY which had an average annual return of 6.04% with a max drawdown of -55%. Both curves are dividend adjusted.

Like its individual components, the AVG strat has done a good job of providing consistent returns comparable with the market, yet with less risk as indicated by the smaller drawdowns. There have certainly been times during bull markets when the SPY has outperformed the AVG strat by a considerable margin (internet bubble, real estate bubble, financial crisis rebound). Where the AVG strat really shines is during bear markets where it has often produced good returns compared to SPY. This is typical of bond performance. Below is a chart of the equity curve drawdowns for the AVG strat and SPY that highlight the improved risk performance of the combined bond strategy.

Let's see what you can expect from the fund's historical performance. The one year rolling returns have averaged a return of 9.7%. What this tells me is that had I chose to invest in the AVG strat anytime in the past 18 years and held it for one year, I would have averaged about 9.7% returns on that one year investment. Also, 89% of the 4250 rolling one year returns were above 0%, so the odds are good that you will make money on your investment over the course of one year. Below is a chart that shows the one year rolling returns for AVG strat (green) with the average of all the rolling one year returns shown in blue.

The rolling one year max drawdowns shows that there have been three substantial (around -20%) drawdowns. The average rolling max drawdown was -2.1%. This tells me I can expect a drawdown of at least -2.1% when I hold this investment for an entire year. Also, 90% of the rolling one year max drawdowns were -5.1% or better, which is much better than the SPY (90% are -22.1% or better). Below is a chart that shows the one year rolling max drawdowns for AVG strat (red) with the average of all these drawdowns in blue.

It is always important to remember that things can change in the future. Regardless, this average bond strategy has done an exceptional job of providing consistent returns through some rough times. The SPY has had a total return of about 288% over the past 18 years because it has been range-bound for most of that time. If you were an exceptional market timer, you could have made much more during this period. For a simpler approach, the average bond strategy has a total return of 337% over the past 18 years with smaller comparative drawdowns (-23% AVG strat compared to -55% SPY). You would have made almost 7% a year using the buy-and-hold average bond strategy, which is a very good return considering bonds are supposed to be a conservative investment.
For this analysis I am assuming that you will allocate a certain percentage of your portfolio to bonds, for example 20%. With that assumption, you would allocate 10% of your portfolio/contributions to FGMNX and 10% to FNMIX to compose the 20% exposure in your account. Obviously, each person's asset allocation will very with age and risk tolerance. The point of this analysis is to compare the performance of the combined average strategy to the individual performances previously reported as well as to the overall performance of a buy-and-hold strategy on the S&P500.
Let's take a peek at the numbers and the past performance of combining the returns of FGMNX and FNMIX (I will call it the AVG strat). The AVG strat has an average annual return of 6.95% over the past 18 years. It pays a monthly dividend and the max drawdown over the past 18 years was -23%. The equity curve is fairly linear with a few sizable drawdowns during overall market retracements. Below is a chart of the equity curve for AVG strat compared to the equity curve of SPY, a surrogate for the performance of the S&P500. The AVG strat performs well compared to the performance of SPY which had an average annual return of 6.04% with a max drawdown of -55%. Both curves are dividend adjusted.

Like its individual components, the AVG strat has done a good job of providing consistent returns comparable with the market, yet with less risk as indicated by the smaller drawdowns. There have certainly been times during bull markets when the SPY has outperformed the AVG strat by a considerable margin (internet bubble, real estate bubble, financial crisis rebound). Where the AVG strat really shines is during bear markets where it has often produced good returns compared to SPY. This is typical of bond performance. Below is a chart of the equity curve drawdowns for the AVG strat and SPY that highlight the improved risk performance of the combined bond strategy.

Let's see what you can expect from the fund's historical performance. The one year rolling returns have averaged a return of 9.7%. What this tells me is that had I chose to invest in the AVG strat anytime in the past 18 years and held it for one year, I would have averaged about 9.7% returns on that one year investment. Also, 89% of the 4250 rolling one year returns were above 0%, so the odds are good that you will make money on your investment over the course of one year. Below is a chart that shows the one year rolling returns for AVG strat (green) with the average of all the rolling one year returns shown in blue.

The rolling one year max drawdowns shows that there have been three substantial (around -20%) drawdowns. The average rolling max drawdown was -2.1%. This tells me I can expect a drawdown of at least -2.1% when I hold this investment for an entire year. Also, 90% of the rolling one year max drawdowns were -5.1% or better, which is much better than the SPY (90% are -22.1% or better). Below is a chart that shows the one year rolling max drawdowns for AVG strat (red) with the average of all these drawdowns in blue.

It is always important to remember that things can change in the future. Regardless, this average bond strategy has done an exceptional job of providing consistent returns through some rough times. The SPY has had a total return of about 288% over the past 18 years because it has been range-bound for most of that time. If you were an exceptional market timer, you could have made much more during this period. For a simpler approach, the average bond strategy has a total return of 337% over the past 18 years with smaller comparative drawdowns (-23% AVG strat compared to -55% SPY). You would have made almost 7% a year using the buy-and-hold average bond strategy, which is a very good return considering bonds are supposed to be a conservative investment.
Monday, February 13, 2012
Trading Thoughts - Combined Bond Performance
I recently posted a historical analysis of two quality bond funds, FGMNX and FNMIX, that have produced consistent returns over the past 18 years. These two bond funds can serve multiple purposes in your portfolio from providing foreign exposure to helping your savings generate reasonable returns. You can check out the posts in the following links:
Best Bond Fund in the World - FGMNX
Another Great Bond Fund - FNMIX
I was thinking that it may be interesting to study the combined performance of the two funds. Most financial advisers suggest having some bond exposure in your investment portfolio. Combining the returns of both FGMNX and FNMIX could provide excellent bond exposure to your portfolio while keeping risk to reasonable levels. It would be a simple strategy to deposit equal amounts into each bond fund. This could also provide consistent monthly dividends for those looking at fixed income investments. I will post an analysis of the combined performance later this week.
Best Bond Fund in the World - FGMNX
Another Great Bond Fund - FNMIX
I was thinking that it may be interesting to study the combined performance of the two funds. Most financial advisers suggest having some bond exposure in your investment portfolio. Combining the returns of both FGMNX and FNMIX could provide excellent bond exposure to your portfolio while keeping risk to reasonable levels. It would be a simple strategy to deposit equal amounts into each bond fund. This could also provide consistent monthly dividends for those looking at fixed income investments. I will post an analysis of the combined performance later this week.
Sunday, February 12, 2012
Trading Thought - Up and Down Trend Filter Differences
I was thinking about trend filters today. It seems to be a common practice to identify the longer term trend and then trade in the direction of the trend. This is supposed to increase the performance of strategies. Normally, most trend filters are purely symmetric, using similar criteria to determine the long and short trend periods. For example, you can say when the price action is above the 200 day moving average the trend is up and when the price is below the 200 day moving average the trend is down. The criteria fro defining the trend are the same except reversed.
Up trends and downtrends have very different characteristics. Up trends are characterized by low volatility and price action that often slowly grinds higher. Tops generally take awhile to form. Down trends are characterized by high volatility and prices that quickly dive down. With up trends and down trends having different characteristics, would it be better to have different trend indicators to identify each one?
It seems like it would be better if I created an indicator that would only be used to identify up trends, then create a separate indicator that would only be used to identify down trends because they are two characteristically different periods. For example, you could use the price crossing above a 200 day moving average to identify an up trend, then you could use price crossing below a 50 day moving average to identify down trends. This philosophy is similar to a moving average fan or the Guppy MMA, except it only uses 2 moving averages instead of many moving averages. From the picture below, you can see that the addition of the 50 period simple moving average seems to improve performance compared to solely using the 200 period simple moving average because it locks in profits quicker than the slower moving average would have by itself. This may also be why many investors use the 50 and 200 day moving average crossover as a timing mechanism, although it seems it may be better to use the price crossing both instead of the averages crossing each other. Testing would be needed to confirm which is better because whipsaws can have a significant impact of performance.

Another alternative would be using the same indicator for both trends, but using a longer time period for up trends (weeks) and down trends (days). For example you could use a 20 period simple moving average on a weekly time frame to determine and up trend, and a 20 period simple moving average on a daily time frame to determine down trends. This would use a slower signal to identify the characteristically slower up trend and a faster signal to identify the characteristically faster down trend. There will be some overlap between the indicators, but this could just be used as a signal that there is an impending trend change.
There would be countless indicators to use. The basic question is if having two different indicators to define an up trend and a down trend is better than having one indicator for both. I think there would be some merit to an asymmetric approach to identifying trends, but it would depend on your trading system. If you trading system shows poor symmetric performance (longs and shorts don't yield the same result), then using an asymmetric filter may be worth investigating.
Up trends and downtrends have very different characteristics. Up trends are characterized by low volatility and price action that often slowly grinds higher. Tops generally take awhile to form. Down trends are characterized by high volatility and prices that quickly dive down. With up trends and down trends having different characteristics, would it be better to have different trend indicators to identify each one?
It seems like it would be better if I created an indicator that would only be used to identify up trends, then create a separate indicator that would only be used to identify down trends because they are two characteristically different periods. For example, you could use the price crossing above a 200 day moving average to identify an up trend, then you could use price crossing below a 50 day moving average to identify down trends. This philosophy is similar to a moving average fan or the Guppy MMA, except it only uses 2 moving averages instead of many moving averages. From the picture below, you can see that the addition of the 50 period simple moving average seems to improve performance compared to solely using the 200 period simple moving average because it locks in profits quicker than the slower moving average would have by itself. This may also be why many investors use the 50 and 200 day moving average crossover as a timing mechanism, although it seems it may be better to use the price crossing both instead of the averages crossing each other. Testing would be needed to confirm which is better because whipsaws can have a significant impact of performance.

Another alternative would be using the same indicator for both trends, but using a longer time period for up trends (weeks) and down trends (days). For example you could use a 20 period simple moving average on a weekly time frame to determine and up trend, and a 20 period simple moving average on a daily time frame to determine down trends. This would use a slower signal to identify the characteristically slower up trend and a faster signal to identify the characteristically faster down trend. There will be some overlap between the indicators, but this could just be used as a signal that there is an impending trend change.
There would be countless indicators to use. The basic question is if having two different indicators to define an up trend and a down trend is better than having one indicator for both. I think there would be some merit to an asymmetric approach to identifying trends, but it would depend on your trading system. If you trading system shows poor symmetric performance (longs and shorts don't yield the same result), then using an asymmetric filter may be worth investigating.
Thursday, February 9, 2012
Trading Thoughts - Another Great Bond Fund
Last time I profiled FGMNX because it was a great bond fund with consistent/linear returns over the past 18 years. FGMNX is great for its robustness and US domestic exposure, but what if you want something with a little more punch to increase your returns?
FNMIX IS A GREAT FUND FOR FOREIGN EXPOSURE AND GOOD RETURNS.
Here is the description from Google Finance - "The investment seeks high current income; capital appreciation is a secondary objective. The fund normally invests at least 80% of assets in securities of issuers in emerging markets (countries that have an emerging stock market as defined by MSCI, countries or markets with low- to middle-income economies as classified by the World Bank, and other countries or markets with similar emerging characteristics) and other investments that are tied economically to emerging markets. It normally invests in debt securities of issuers in emerging markets. The fund potentially invests in other types of securities. It is non-diversified." In addition, the FNMIX has a 4 star Morningstar rating over the past 10 years, has an expense ratio of 0.89%, and assets totaling $4.6 billion.
FNMIX gives you the increased returns of foreign (emerging market) exposure with less volatility than a stock equivalent. Let's take a peek at the numbers and the past performance. FNMIX has an average annual return of 9.5% over the past 18 years. It pays a monthly dividend and the max drawdown over the past 18 years was -43%. The equity curve is fairly linear with a few sizeable drawdowns during market retracements. Below is a chart of the equity curve for FNMIX compared to the equity curve of SPY, a surrogate for the performance of the S&P500. Both curves are dividend adjusted.

This bond fund has done a good job of providing consistent returns comparable with the market, yet with less risk as indicated by the smaller drawdowns. I would say that FNMIX is best used as a way to diversify your portfolio with foreign exposure with the added benefit of adding the cushion of a bond to hedge against some of the stock volatility you can experience during bear markets. It is a good alternative to other foreign investments for the risk-adverse. Below is a chart of the equity curve drawdowns for FNMIX and SPY.

Let's see what you can expect from the fund's historical performance. The one year rolling returns have averaged a return of 13.4%. What this tells me is that had I chose to invest in FNMIX anytime in the past 18 years and held it for one year, I would have averaged about 13.4% returns on that one year investment. Also, 84% of the 4250 rolling one year returns were above 0%, so the odds are good that you will make money on your investment over the course of one year. Below is a chart that shows the one year rolling returns for FNMIX (green) with the average of all these returns in blue.

The rolling one year max drawdowns shows that there have been three substantial (<-20%) drawdowns. The average rolling max drawdown was -4.9%. This tells me I can expect a drawdown of at least -4.9% when I hold this investment for an entire year. Also, 90% of the rolling one year max drawdowns were -15.2% or better, which is much better than the SPY (90% are -22.1% or better). Below is a chart that shows the one year rolling max drawdowns for FGMNX (red) with the average of all these drawdowns in blue.

Now you may be asking why I am focusing on bonds. Bonds are a good way to capture market alpha without all the volatility and noise associated with stocks. The SPY has had a total return of about 288% over the past 18 years because it has been range-bound for most of that time. If you were an exceptional market timer, you could have made much more during this period. For those who like to keep things simple, bonds offer a great way to capture that performance. FNMIX has a total return of 519% over the past 18 years with smaller comparative drawdowns. You would have made almost 10% a year with a buy-and-hold strategy using this bond, which is difficult to imagine for most investments in the current era of market uncertainty.
FNMIX IS A GREAT FUND FOR FOREIGN EXPOSURE AND GOOD RETURNS.
Here is the description from Google Finance - "The investment seeks high current income; capital appreciation is a secondary objective. The fund normally invests at least 80% of assets in securities of issuers in emerging markets (countries that have an emerging stock market as defined by MSCI, countries or markets with low- to middle-income economies as classified by the World Bank, and other countries or markets with similar emerging characteristics) and other investments that are tied economically to emerging markets. It normally invests in debt securities of issuers in emerging markets. The fund potentially invests in other types of securities. It is non-diversified." In addition, the FNMIX has a 4 star Morningstar rating over the past 10 years, has an expense ratio of 0.89%, and assets totaling $4.6 billion.
FNMIX gives you the increased returns of foreign (emerging market) exposure with less volatility than a stock equivalent. Let's take a peek at the numbers and the past performance. FNMIX has an average annual return of 9.5% over the past 18 years. It pays a monthly dividend and the max drawdown over the past 18 years was -43%. The equity curve is fairly linear with a few sizeable drawdowns during market retracements. Below is a chart of the equity curve for FNMIX compared to the equity curve of SPY, a surrogate for the performance of the S&P500. Both curves are dividend adjusted.

This bond fund has done a good job of providing consistent returns comparable with the market, yet with less risk as indicated by the smaller drawdowns. I would say that FNMIX is best used as a way to diversify your portfolio with foreign exposure with the added benefit of adding the cushion of a bond to hedge against some of the stock volatility you can experience during bear markets. It is a good alternative to other foreign investments for the risk-adverse. Below is a chart of the equity curve drawdowns for FNMIX and SPY.

Let's see what you can expect from the fund's historical performance. The one year rolling returns have averaged a return of 13.4%. What this tells me is that had I chose to invest in FNMIX anytime in the past 18 years and held it for one year, I would have averaged about 13.4% returns on that one year investment. Also, 84% of the 4250 rolling one year returns were above 0%, so the odds are good that you will make money on your investment over the course of one year. Below is a chart that shows the one year rolling returns for FNMIX (green) with the average of all these returns in blue.

The rolling one year max drawdowns shows that there have been three substantial (<-20%) drawdowns. The average rolling max drawdown was -4.9%. This tells me I can expect a drawdown of at least -4.9% when I hold this investment for an entire year. Also, 90% of the rolling one year max drawdowns were -15.2% or better, which is much better than the SPY (90% are -22.1% or better). Below is a chart that shows the one year rolling max drawdowns for FGMNX (red) with the average of all these drawdowns in blue.

Now you may be asking why I am focusing on bonds. Bonds are a good way to capture market alpha without all the volatility and noise associated with stocks. The SPY has had a total return of about 288% over the past 18 years because it has been range-bound for most of that time. If you were an exceptional market timer, you could have made much more during this period. For those who like to keep things simple, bonds offer a great way to capture that performance. FNMIX has a total return of 519% over the past 18 years with smaller comparative drawdowns. You would have made almost 10% a year with a buy-and-hold strategy using this bond, which is difficult to imagine for most investments in the current era of market uncertainty.
Monday, February 6, 2012
Trading Thoughts - The Best Bond Fund in the World
Well that title may be a bit subjective. It seems like the world is always battling some kind of crisis which can add a considerable amount of volatility to the returns of the stock market. Trying to find a safer investment with a consistent history of returns can often be difficult, especially when most trading products are correlated with the overall market performance.
THIS IS WHY FGMNX IS THE GREATEST BOND FUND IN THE WORLD (right now)
Here is the Google Finance description of FGMNX - "The investment seeks a high level of current income. The fund normally invests at least 80% of assets in Ginnie Maes and repurchase agreements for Ginnie Maes. It invests in other U.S. government securities and instruments related to U.S. government securities and in U.S. government securities issued by entities that are chartered or sponsored by Congress but whose securities are neither issued nor guaranteed by the U.S. Treasury. The fund allocates assets across different market sectors and maturities and seeks to have similar overall interest rate risk to the Barclays Capital® GNMA Index. " In addition, the FGMNX has a 5 star Morningstar rating over the past 10 years, has an expense ratio of 0.45%, and assets totaling $9.8 billion.
Let's take a peek at the numbers and the past performance. FGMNX has an average annual return of 3.5% over the past 18 years. It helps that is pays a monthly dividend which helps insulate it from very large drawdowns. The max drawdown over the past 18 years was 6.43%. The equity curve is quite linear and the returns are uncorrelated with the market. Below is a chart of the equity curve for FGMNX compared to the equity curve of SPY, a surrogate for the performance of the S&P500. Both curves are dividend adjusted.

The point of this bond fund is not to outperform the S&P500. FGMNX is best utilized as as safe house during bear market drawdowns in the markets. FGMNX also serves as a good investment to act as a savings vehicle. At the time of this post, most savings accounts are returning less than 1% a year. FGMNX has consistently returned higher than this with little risk. I personally invest all of my short-term savings in FGMNX. Below is a chart of the equity curve drawdowns for FGMNX and SPY.

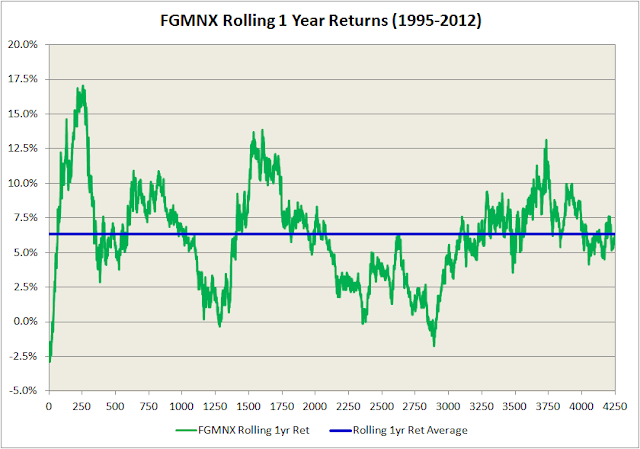
Let's dig a little deeper into the performance to get a better idea of what you can expect from the fund. I like to look at the one year rolling returns to get a sense of what to expect. The average rolling return was 6.3%. What this tells me is that had I chose to invest in FGMNX anytime in the past 18 years and held it for one year, I would have averaged about 6.3% returns on that one year investment. Also, 98% of the 4250 rolling one year returns were above 0%, so the odds are good that you will make money on your investment over the course of one year. Below is a chart that shows the one year rolling returns for FGMNX (green) with the average of all these returns in blue.
In order to understand the risk associated with FGMNX, I like to study the rolling one year max drawdowns. The average rolling max drawdown was -0.5%. This tells me I can expect a drawdown of at least 0.5% when I hold this investment for an entire year. Also, 90% of the rolling one year max drawdowns were -1.5% or better, so that is limited risk. Below is a chart that shows the one year rolling max drawdowns for FGMNX (red) with the average of all these drawdowns in blue.

It is always important to remember that things can change in the future. Regardless, this fund has done an exceptional job of providing consistent returns through some rough times, including the financial crisis of 2008-2009. I will continue to us it for my short-term savings and as a safe-haven during bear markets.
THIS IS WHY FGMNX IS THE GREATEST BOND FUND IN THE WORLD (right now)
Here is the Google Finance description of FGMNX - "The investment seeks a high level of current income. The fund normally invests at least 80% of assets in Ginnie Maes and repurchase agreements for Ginnie Maes. It invests in other U.S. government securities and instruments related to U.S. government securities and in U.S. government securities issued by entities that are chartered or sponsored by Congress but whose securities are neither issued nor guaranteed by the U.S. Treasury. The fund allocates assets across different market sectors and maturities and seeks to have similar overall interest rate risk to the Barclays Capital® GNMA Index. " In addition, the FGMNX has a 5 star Morningstar rating over the past 10 years, has an expense ratio of 0.45%, and assets totaling $9.8 billion.
Let's take a peek at the numbers and the past performance. FGMNX has an average annual return of 3.5% over the past 18 years. It helps that is pays a monthly dividend which helps insulate it from very large drawdowns. The max drawdown over the past 18 years was 6.43%. The equity curve is quite linear and the returns are uncorrelated with the market. Below is a chart of the equity curve for FGMNX compared to the equity curve of SPY, a surrogate for the performance of the S&P500. Both curves are dividend adjusted.

The point of this bond fund is not to outperform the S&P500. FGMNX is best utilized as as safe house during bear market drawdowns in the markets. FGMNX also serves as a good investment to act as a savings vehicle. At the time of this post, most savings accounts are returning less than 1% a year. FGMNX has consistently returned higher than this with little risk. I personally invest all of my short-term savings in FGMNX. Below is a chart of the equity curve drawdowns for FGMNX and SPY.

Let's dig a little deeper into the performance to get a better idea of what you can expect from the fund. I like to look at the one year rolling returns to get a sense of what to expect. The average rolling return was 6.3%. What this tells me is that had I chose to invest in FGMNX anytime in the past 18 years and held it for one year, I would have averaged about 6.3% returns on that one year investment. Also, 98% of the 4250 rolling one year returns were above 0%, so the odds are good that you will make money on your investment over the course of one year. Below is a chart that shows the one year rolling returns for FGMNX (green) with the average of all these returns in blue.

In order to understand the risk associated with FGMNX, I like to study the rolling one year max drawdowns. The average rolling max drawdown was -0.5%. This tells me I can expect a drawdown of at least 0.5% when I hold this investment for an entire year. Also, 90% of the rolling one year max drawdowns were -1.5% or better, so that is limited risk. Below is a chart that shows the one year rolling max drawdowns for FGMNX (red) with the average of all these drawdowns in blue.

It is always important to remember that things can change in the future. Regardless, this fund has done an exceptional job of providing consistent returns through some rough times, including the financial crisis of 2008-2009. I will continue to us it for my short-term savings and as a safe-haven during bear markets.
Friday, February 3, 2012
Trading Thoughts - What a Failed Trade Signals
I was watching a webinar by Andy Carlsen called "Tight Stop Trading for Gold, Crude Oil, and E-Mini Russell" on TraderKingdom.com. In the webinar, he discussed his day trading and showed his charts. He mentioned that sometimes his trade entries result in a failure, but this failure often leads to a failure continuation trade. This was a very interesting concept that I never really considered before.

Most of the time we will trade our systems, make our entries, then exit our positions. Sometimes this results in a profit, and sometimes it results in a loss. After this process is complete, we start over again and look for another entry. The failure continuation trade is interesting because it uses the failure of the original signal as a signal itself to reverse the position. In the webinar, the original signal would quickly fail for a small loss, but the position would be reversed and often lead to a winning trade. Rarely was there a failure of the original signal followed by a failure of the failure continuation trade.
This is just an interesting twist to add to a system and something extra to evaluate. I have read countless times that it is important to be a nimble trader and not get married to a position. The failure continuation trade can help solve this issue. When the original position is complete, can you squeeze out more profit by reversing direction? Of course this would not be applicable to symmetric systems that are always in the market, long or short. Perhaps you have a system that is not profitable, but then you can evaluate a failure continuation trade to couple with the system to potentially turn it into a profitable system.
I guess it is important to remember that a trade is not over until it's over...

Most of the time we will trade our systems, make our entries, then exit our positions. Sometimes this results in a profit, and sometimes it results in a loss. After this process is complete, we start over again and look for another entry. The failure continuation trade is interesting because it uses the failure of the original signal as a signal itself to reverse the position. In the webinar, the original signal would quickly fail for a small loss, but the position would be reversed and often lead to a winning trade. Rarely was there a failure of the original signal followed by a failure of the failure continuation trade.
This is just an interesting twist to add to a system and something extra to evaluate. I have read countless times that it is important to be a nimble trader and not get married to a position. The failure continuation trade can help solve this issue. When the original position is complete, can you squeeze out more profit by reversing direction? Of course this would not be applicable to symmetric systems that are always in the market, long or short. Perhaps you have a system that is not profitable, but then you can evaluate a failure continuation trade to couple with the system to potentially turn it into a profitable system.
I guess it is important to remember that a trade is not over until it's over...
Thursday, February 2, 2012
Trading Thoughts - Auto-tuning Tick Charts to Match Renko
Like I have said before in prior posts, I am a fan of renko charts because they simplify the price action and act somewhat like a price filter. Unfortunately, they can be terrible for entries and exits because the price can pass through a wide range before the next bar is formed. I had a thought that it would be nice to be able to use a tick chart that was sized in such a way that it would match a corresponding renko chart. Below is a picture of a renko chart with a range of 2.

You can use the average near-term volume to determine a good tick chart size that will be representative of the renko 2 chart. In this case, I used a 20 period simple moving average. The picture above shows that the average volume is around 160. It seems that a tick size about 50% of the renko average volume produces a plot that is similar in appearance. Below is a picture of a chart with a tick size of 80, which is about 50% of the average volume from the above chart.

A comparison of the two charts shows that they are quite similar. The advantage of using the tick chart, is that we can use indicators from the renko chart to interpret signals on the tick chart. It is often easy to read indicators based on renko charts because the price action is much cleaner. Obviously, you would want to create a program that would auto-tune your chart to display the correct tick price action. An indicator could be created to represent the price action (OHLC) in the correct tick format. It is important to note that you need to be careful to make sure that there is enough volume. You don't want to be trading a chart with an average volume of 5 ticks because it could create a lot of problems. I would suggest putting a minimum requirement that the number of ticks cannot go below, for example 30.

You can use the average near-term volume to determine a good tick chart size that will be representative of the renko 2 chart. In this case, I used a 20 period simple moving average. The picture above shows that the average volume is around 160. It seems that a tick size about 50% of the renko average volume produces a plot that is similar in appearance. Below is a picture of a chart with a tick size of 80, which is about 50% of the average volume from the above chart.

A comparison of the two charts shows that they are quite similar. The advantage of using the tick chart, is that we can use indicators from the renko chart to interpret signals on the tick chart. It is often easy to read indicators based on renko charts because the price action is much cleaner. Obviously, you would want to create a program that would auto-tune your chart to display the correct tick price action. An indicator could be created to represent the price action (OHLC) in the correct tick format. It is important to note that you need to be careful to make sure that there is enough volume. You don't want to be trading a chart with an average volume of 5 ticks because it could create a lot of problems. I would suggest putting a minimum requirement that the number of ticks cannot go below, for example 30.
Tuesday, January 31, 2012
Trading Thoughts - When Bad Things Happen
I have done a lot of research on trading that has included all sorts of topics including indicators, analysis, risk management, psychology, etc. Something I have rarely seen addressed though are the actual technical problems involved with trading full-time from home. Things may be different if you work at an established company because if something does go wrong, there are usually measures in place to fix things quickly or prevent bad things from happening.
When I say bad things, I am referring to the technical aspects of trading not involved with the strategy itself. I am referring to a plan of action if something breaks or the power goes out. Below is a list of bad things that could happen:
I am sure there or many more problems that can occur. At some point, I need to develop emergency action plans to prevent or account for these scenarios. I can't imagine how terrible it would be if some of these things occurred and I was not prepared. Are you prepared?
When I say bad things, I am referring to the technical aspects of trading not involved with the strategy itself. I am referring to a plan of action if something breaks or the power goes out. Below is a list of bad things that could happen:
- Computer hard drive crashes (no cpu for days = no money made in the market)
- Monitors fail
- Mouse breaks
- Virus attacks your computer and freezes the cpu
- Trading software strategy is out of sync with actual account positions
- Microsoft Windows update restarts your computer without your knowledge, shutting down your automated trading system
- Power to your home goes out
- Cable internet connection goes down
- DSL internet connection goes down
- Home burns down or is flooded (off-site backup of strategies)
- Brokerage server connection goes down
- Insane market behavior and flash crashes
- Futures market reaches limit move
- Brokerage company unexpectedly closes or goes bankrupt (ex. MF Global)
I am sure there or many more problems that can occur. At some point, I need to develop emergency action plans to prevent or account for these scenarios. I can't imagine how terrible it would be if some of these things occurred and I was not prepared. Are you prepared?
Trading Thoughts - Value Entries and Improved Performance
I was watching a webinar the other day by Andy Carlen over at TraderKingdom.com called "Tight Stop Trading for Gold, Crude Oil, and E-Mini Russell". He made a point that had a impact on me and my view of entries. He briefly discussed the issue of value entries. The idea is simple, but the effect can have an incredible impact on your trading results and system.
A value entry is an entry at a better price than the initial price when your system signals you to enter. It seems like many systems traders use only one contract to enter and exit. If the system has a positive expectancy, value entries provide a method for improving your system metrics in two ways: reducing your risk on the position and increasing your profit on your position. Now you may not always be able to enter at a better price than the initial entry price because sometimes the price takes off and never looks back.
Let's look at a quick example. Let's say you have a system with a winning percentage of 50%, an average win of 10 ticks, an average loss of 5 ticks, and an expectancy of 2.5 ticks. The system normally only enters and exit with one contract. Let's say you decide to add value entries. Through testing you find out that 25% of the time you are able to enter with a second contract at a value entry with a price 1 tick better than the initial entry. Now assuming you still make the same exits, your average win for the value entry is 11 ticks, your average loss is 4 ticks, and your expectancy for the value entry position is 3.5 ticks. The value entry will increase the size of your average winner and decrease the size of your average loser. This is a powerful concept because it adds up over time.
Now this sure seems similar to averaging down, which many professionals will argue is a poor practice. I would say there is one subtle, yet important difference between averaging down and value entries. Averaging down is a result of an emotional urge to avoid losers in a futile attempt to justify the correctness of your position, while value entries are a validated/tested money management method to improve your strategy performance. Value entries are planned while averaging down is more of an impromptu reaction. The difference is all in the plan, remember that.
A value entry is an entry at a better price than the initial price when your system signals you to enter. It seems like many systems traders use only one contract to enter and exit. If the system has a positive expectancy, value entries provide a method for improving your system metrics in two ways: reducing your risk on the position and increasing your profit on your position. Now you may not always be able to enter at a better price than the initial entry price because sometimes the price takes off and never looks back.
Let's look at a quick example. Let's say you have a system with a winning percentage of 50%, an average win of 10 ticks, an average loss of 5 ticks, and an expectancy of 2.5 ticks. The system normally only enters and exit with one contract. Let's say you decide to add value entries. Through testing you find out that 25% of the time you are able to enter with a second contract at a value entry with a price 1 tick better than the initial entry. Now assuming you still make the same exits, your average win for the value entry is 11 ticks, your average loss is 4 ticks, and your expectancy for the value entry position is 3.5 ticks. The value entry will increase the size of your average winner and decrease the size of your average loser. This is a powerful concept because it adds up over time.
Now this sure seems similar to averaging down, which many professionals will argue is a poor practice. I would say there is one subtle, yet important difference between averaging down and value entries. Averaging down is a result of an emotional urge to avoid losers in a futile attempt to justify the correctness of your position, while value entries are a validated/tested money management method to improve your strategy performance. Value entries are planned while averaging down is more of an impromptu reaction. The difference is all in the plan, remember that.
Monday, January 30, 2012
Trading Thoughts - Time to Trade
When is the best time to trade futures? Futures trade nearly 24 hours a day for most of the week. As someone who works full time, it is tempting to believe that I could try to trade futures live either before the work day begins or after it is over. The question is one of liquidity. I have not yet examined the around-the-clock volumes of all the futures contracts. In fact, I am not sure what kind of volume is required for a one-contract trader to experience reasonable spreads. Would it be good to use a criteria of 15 contracts a minute, 10 contracts for a range 4 chart, or trade using a 30 tick chart?
I am not really sure how to answer that question and what setting would be optimal to reduce slippage and establish minimum volume requirements for good liquidity. I have read in some forums that trading most contract between 7am (eastern) to 4pm (eastern) provides enough liquidity, and this seems to be clear when viewing the charts during those hours. Although, there appears to be an uptick in contract volume beginning around 2am (eastern) which probably corresponds to the European markets opening. I do not know how to gauge if there is enough volume during the early morning hours to justify trading. Additionally, I think it would be better to avoid scalping small trades during the off-peak hours, and look to trade larger ranges.
Besides regular, live trading experience, how do you determine if there is enough liquidity present to support your money management system?
Tuesday, January 24, 2012
Trading Thoughts - Progress?
I seem to spend a great deal of time watching the markets. I enjoy looking for patterns and coming up with new indicators to code. Even though this is an enjoyable and sometimes beneficial experience, I know i am not making the best use of my time. I have a tendency to play around with the code and briefly inspect the results of the modifications as compared to the recent price data over the past couple of days. This is an improper way to analyze the effectiveness of a new indicator or trading idea.
For instance, I probably spent about 2 hours last night "playing around" with some indicators I have been working on. The end result of my efforts is nothing. How can I measure progress if i have no measurable results for my research. In the academic world, I would proceed with my research to the point where I could accept or reject my hypothesis, often times performing statistical analyses. For some reason, I am not using the same methods to evaluate my trading ideas. Therefore, I am not getting the most out of my time. This is very frustrating. It is even more frustrating because I keep doing it each day.
I think the best way to put a stop to this is to conceptually design a strategy with a couple basic indicators, perhaps 3-5 indicators. Then I should practice day trading it or backtesting it (if possible) to see if there is any edge. If there seems to be an edge, then I need to evaluate each component of the the strategy. For example, if I am using a trend filter, I need to determine if the likelihood of the the price data showing gains when the filter indicates and up trend and vice versa for downtrends. If I know that information, I have a starting point for making modifications to the filter. Once completed, I then need to move on to the other aspects of the strategy. This task seems incredibly time consuming if I cannot backtest my strategy. I am hoping to clear this issue up in the near future so I can get back on track.
For instance, I probably spent about 2 hours last night "playing around" with some indicators I have been working on. The end result of my efforts is nothing. How can I measure progress if i have no measurable results for my research. In the academic world, I would proceed with my research to the point where I could accept or reject my hypothesis, often times performing statistical analyses. For some reason, I am not using the same methods to evaluate my trading ideas. Therefore, I am not getting the most out of my time. This is very frustrating. It is even more frustrating because I keep doing it each day.
I think the best way to put a stop to this is to conceptually design a strategy with a couple basic indicators, perhaps 3-5 indicators. Then I should practice day trading it or backtesting it (if possible) to see if there is any edge. If there seems to be an edge, then I need to evaluate each component of the the strategy. For example, if I am using a trend filter, I need to determine if the likelihood of the the price data showing gains when the filter indicates and up trend and vice versa for downtrends. If I know that information, I have a starting point for making modifications to the filter. Once completed, I then need to move on to the other aspects of the strategy. This task seems incredibly time consuming if I cannot backtest my strategy. I am hoping to clear this issue up in the near future so I can get back on track.
Monday, January 23, 2012
Trading Thoughts - Trading vs. Planning
I was speaking to my fiance yesterday and she asked me how my trading was going. I told her that I was pretty productive this weekend and I made a lot of progress towards getting organized and developing my trading plans. She responded by saying that it seems I spend a majority of my time planning instead of trading. This comment really made me think. Should traders spend more of their time trading or planning?
Now I want to make it clear that when I say planning, I am not referring to a trading plan. A trading plan is critical and you should not be trading live without one. When I say planning, I mean scheduling out tasks and procedures such as what you are going to do for the day, how you are going to backtest an idea, what books you are going to read, etc. For instance, I spent time this past weekend revising my daily trading schedule. I needed to update it in order to make sure I was getting the most out of each day. I also want to create a weekly schedule because there are so many trading related activities that I cannot fit all of them in everyday. So I need to put time to creating a schedule to ensure that each week I am accomplishing all my objectives and covering all the areas of my trading activities. This is what I am referring to when I say planning. This task would be so much easier if I had a boss or coach devoted to scheduling my time in order to maximize my performance. Since there is no such person, the responsibility is solely mine.
Trading vs planning is a difficult argument because there seems to be a balance between the two. If you look at the extremes, neither option is good. You would never want to spend all your time planning without trading because you can become lost in the search for the holy grail as well as become somewhat disconnected from the live, psychological action of the market. On the flip side, it would be a terrible idea (and costly) to spend all your time trading without a plan because your actions would most likely be dominated by emotions and plus you would have no way of evaluating your performance against a specified benchmark or plan. Therefore there must be a balance between the two.
This topic is probably less difficult for those lucky individuals who are trading full time. Unfortunately for me, I have a full-time job in engineering which takes up most of my week. That leaves me with only the morning, evenings, and weekends to work on my trading. There is little room for error because my free time is at a minimum.
Personally, I lean towards mechanical system trading as opposed to discretionary trading. I believe that a majority of my time is well spent researching and testing methods to apply to the live market. At the same time, most of my ideas come from either trying to trade the market are watching the live market throughout the day. I do believe in performance evaluation, so i think it is critical to have some guidelines. I don't think you can strictly evaluate performance by looking at your PnL statement for the day because there are many other factors that determine if you traded well. I also believe in having standard procedures for researching topics, so time must be spent on these procedures. Once they are in place, it makes researching a more efficient process and ultimately save you time. One final note, I believe a plan is critical because it lays out a path to success. In trading, one day I feel like i am gonna be a millionaire, the next day I feel like I am back at square one. With a plan in place, I can feel a since of accomplishment regardless of if the outcome is profitable or not. I believe that goes a long way to preventing burn out and hopelessness.
While planning is necessary, it is important to remember what you are planning for and that is why trading (whether sim or live) is important. It would be like training for a race that you never run, it would be very easy to lose sight of your goal. This is why it is necessary to also get as much screen time as possible. It helps you familiarize yourself with your trading products. It will also provide countless ideas for trading indicators and systems, which provides more ammo for your planning.
I guess what it all boils down to is loving the process. Whether it is trading or planning, as long as you love what your are doing the rest doesn't really matter much. When it becomes a chore or a burden, then something needs to change. There should be something besides money that drives you to pursue a path to successful trading.
Now I want to make it clear that when I say planning, I am not referring to a trading plan. A trading plan is critical and you should not be trading live without one. When I say planning, I mean scheduling out tasks and procedures such as what you are going to do for the day, how you are going to backtest an idea, what books you are going to read, etc. For instance, I spent time this past weekend revising my daily trading schedule. I needed to update it in order to make sure I was getting the most out of each day. I also want to create a weekly schedule because there are so many trading related activities that I cannot fit all of them in everyday. So I need to put time to creating a schedule to ensure that each week I am accomplishing all my objectives and covering all the areas of my trading activities. This is what I am referring to when I say planning. This task would be so much easier if I had a boss or coach devoted to scheduling my time in order to maximize my performance. Since there is no such person, the responsibility is solely mine.
Trading vs planning is a difficult argument because there seems to be a balance between the two. If you look at the extremes, neither option is good. You would never want to spend all your time planning without trading because you can become lost in the search for the holy grail as well as become somewhat disconnected from the live, psychological action of the market. On the flip side, it would be a terrible idea (and costly) to spend all your time trading without a plan because your actions would most likely be dominated by emotions and plus you would have no way of evaluating your performance against a specified benchmark or plan. Therefore there must be a balance between the two.
This topic is probably less difficult for those lucky individuals who are trading full time. Unfortunately for me, I have a full-time job in engineering which takes up most of my week. That leaves me with only the morning, evenings, and weekends to work on my trading. There is little room for error because my free time is at a minimum.
Personally, I lean towards mechanical system trading as opposed to discretionary trading. I believe that a majority of my time is well spent researching and testing methods to apply to the live market. At the same time, most of my ideas come from either trying to trade the market are watching the live market throughout the day. I do believe in performance evaluation, so i think it is critical to have some guidelines. I don't think you can strictly evaluate performance by looking at your PnL statement for the day because there are many other factors that determine if you traded well. I also believe in having standard procedures for researching topics, so time must be spent on these procedures. Once they are in place, it makes researching a more efficient process and ultimately save you time. One final note, I believe a plan is critical because it lays out a path to success. In trading, one day I feel like i am gonna be a millionaire, the next day I feel like I am back at square one. With a plan in place, I can feel a since of accomplishment regardless of if the outcome is profitable or not. I believe that goes a long way to preventing burn out and hopelessness.
While planning is necessary, it is important to remember what you are planning for and that is why trading (whether sim or live) is important. It would be like training for a race that you never run, it would be very easy to lose sight of your goal. This is why it is necessary to also get as much screen time as possible. It helps you familiarize yourself with your trading products. It will also provide countless ideas for trading indicators and systems, which provides more ammo for your planning.
I guess what it all boils down to is loving the process. Whether it is trading or planning, as long as you love what your are doing the rest doesn't really matter much. When it becomes a chore or a burden, then something needs to change. There should be something besides money that drives you to pursue a path to successful trading.
Sunday, January 22, 2012
Trading Thoughts - Indicator and Strategy Evaluation
In an attempt to become more organized and more efficient, I have realized I need to determine a procedure for evaluating trading indicators and strategies. The procedure should be a simple, repeatable, and robust process with clear milestones that determine whether further testing is warranted.
Unfortunately, there seem to be a countless number of ways to evaluate a trading system. Thankfully, there is a whole niche of books devoted to trading system development and evaluation. I have made a list of the books and will begin reading them this year with the goal of refining my personal system evaluation procedures and development processes. I recently purchased "Systems Trading for Spread Betting: An End-To-End Guide for Developing Spread Betting Systems" by Gary Ford. This seems like a good starter book because it walks through the fundamental steps of creating and evaluating a trading system. Currently, I am not interested in spread betting, but I am always looking to learn something new. The real bonus is that the author uses NinjaTrader for the system development and evaluation, which should significantly improve my platform skills.
I will eventually develop an entire post/plan for my evaluation procedures and add it to the side bar, but for now this is more of a kick-off post to highlight the various areas of system evaluation. From what I have seen, below is a list of topics that my system evaluation procedure should address:
Unfortunately, there seem to be a countless number of ways to evaluate a trading system. Thankfully, there is a whole niche of books devoted to trading system development and evaluation. I have made a list of the books and will begin reading them this year with the goal of refining my personal system evaluation procedures and development processes. I recently purchased "Systems Trading for Spread Betting: An End-To-End Guide for Developing Spread Betting Systems" by Gary Ford. This seems like a good starter book because it walks through the fundamental steps of creating and evaluating a trading system. Currently, I am not interested in spread betting, but I am always looking to learn something new. The real bonus is that the author uses NinjaTrader for the system development and evaluation, which should significantly improve my platform skills.
I will eventually develop an entire post/plan for my evaluation procedures and add it to the side bar, but for now this is more of a kick-off post to highlight the various areas of system evaluation. From what I have seen, below is a list of topics that my system evaluation procedure should address:
- Time frame analysis (ticks, minutes, hours, days, etc.)
- Day trading time analysis (what hours during the trading session)
- Contributions of each aspect of the indicator/strategy
- Entries and Exits
- Filters for volume and volatility
- Backtesting
- Risk management and position sizing
- Parameter optimization
- Walk Forward optimization
- Monte Carlo simulation
- Bootstrap analysis
- Stochastic process control theory analysis
- Simulated strategy trading
- Live trading
This is just an initial list of topics to be investigated. Hopefully, once I have read a few books on the subject I will have the basic steps of my procedure in place and I can begin evaluating systems on this website. My initial goal would be to evaluate at least one indicator/strategy a week. The primary goal would be to familiarize myself with each procedural component to better understand its strengths and weaknesses. Once that is accomplished, I can then focus on determining the true merits of a sample trading system.
Subscribe to:
Posts (Atom)