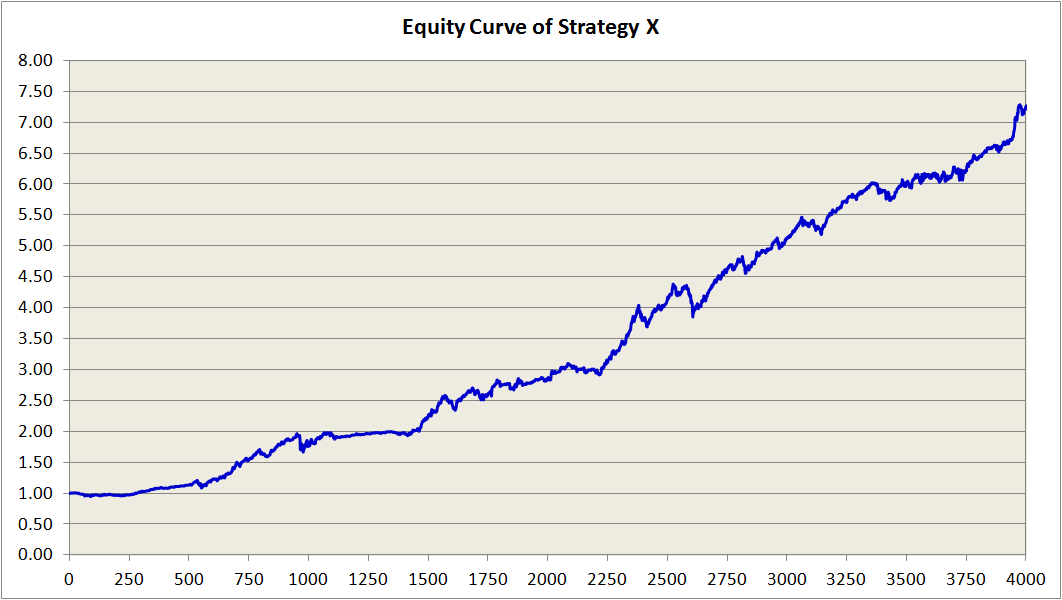
You can tell from the equity curve that returns have been stable for many years and returns are very consistent. The strategy has returned an average annual return around 11% and a max drawdown around -15%. The average annual return for a buy-and-hold S&P500 strategy is 6% with a max drawdown of -55%. Strategy X easily beats a buy-and-hold strategy on the S&P500 both in terms of profit and risk. Below is a plot of the drawdowns for the Strategy X equity curve.

I would say that this strategy seems to be a consistent performer with very low risk compared to many other strategies. Here is the best part, I will be revealing all the aspects of this strategy in a post in the very near future. I will tell you what instruments are being used and how you determine when to enter and exit positions. It will become another trading plan to add to my portfolio of systems. I hope that the strategy will be able to help you in your investing.
No comments:
Post a Comment